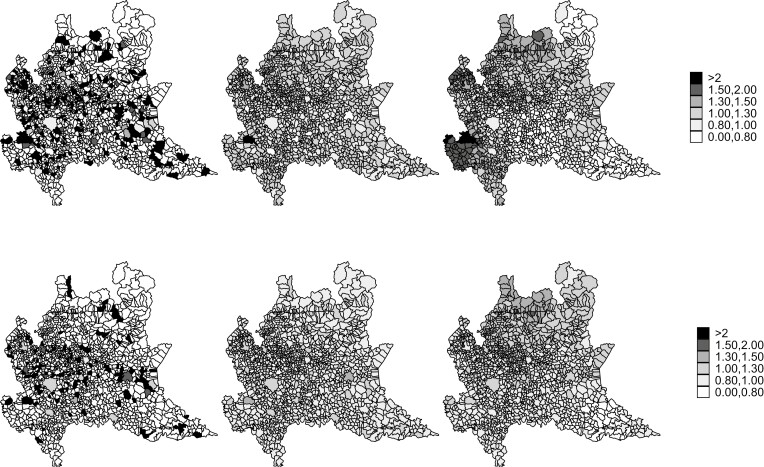
Figure 3.
Maps of standardized incidence ratios (SIR) and posterior relative risks (RR) of sinonasal cancers (SNC) by gender and municipality of residence at diagnosis, Lombardy SNC Registry, Italy, 2008–20. Top panels: men; bottom panels: women; left panels: SIR; middle panels: posterior RR from the Poisson-Gamma (PG) models; right panels: posterior RR from the Besag, York, and Mollié (BYM) models.

