
Figure 2.
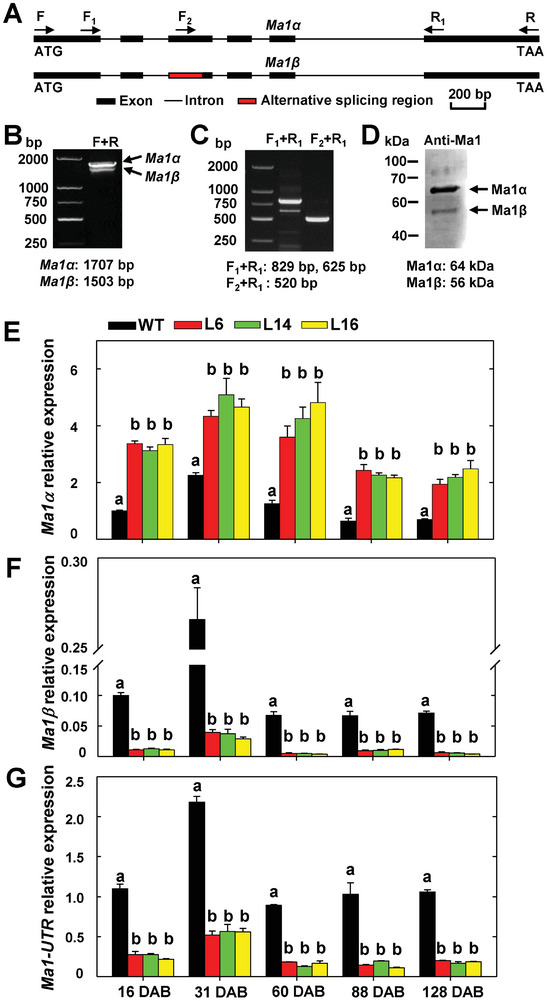
Generation of two transcript isoforms by Ma1 alternative splicing and suppression of native Ma1 expression by cMa1 overexpression in “Royal Gala” apple. A) Schematic representation of the genomic structure of Ma1 and the splicing region. The exact locations of the primers shown are marked in Figure S1 (Supporting Information). B,C) Detection of alternatively spliced Ma1 transcripts by RT‐PCR. D) Detection of alternatively splicing‐generated Ma1 protein isoforms in WT “Royal Gala” at peak fruit acidity (31 DAB) by immunoblotting using an antibody generated against peptide ELSEKANFKDPVEA (see Figure S2, Supporting Information) in rabbit, which recognizes both Ma1α and Ma1β. E) Expression levels of Ma1α transcripts in the fruits of WT and cMa1‐OE lines (L6, L14, L16) over five developmental stages as described in Figure 1. DAB: Days After Bloom. F) Expression levels of Ma1β transcripts in the fruits of WT and cMa1‐OE lines during fruit development. G) Transcript levels of the native Ma1 gene in the fruits of WT and cMa1‐OE lines during fruit development. In (E) to (G), quantitative RT‐PCR was performed using gene‐specific primers (Table S3, Supporting Information), with actin as the internal reference gene, and the relative expression level of each gene was obtained using the ddCT method. Data in (E) to (G) are mean ± SE of five biological replicates, with six fruits pooled from two trees per replicate. Different letters (a, b) indicate significant differences between groups using Tukey's HSD test at p < 0.05 after ANOVA.