
Figure 5.
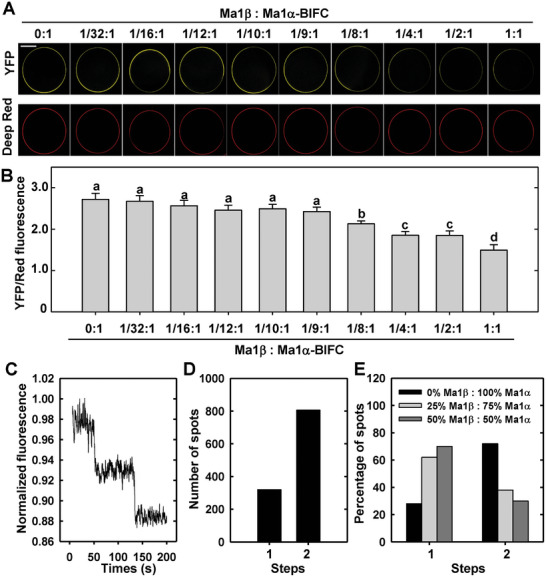
Competition of Ma1β with Ma1α for binding to Ma1α and the oligomeric state of Ma1. A) Representative images of the change in the YFP signal from Ma1α‐Ma1α bimolecular fluorescence complementation (BiFC) in oocytes (i.e., coexpression of Ma1α‐nYFP and Ma1α‐cYFP) in response to the addition of non‐tagged Ma1β at the indicated ratios. The total amount of Ma1α cRNA was fixed at 50 ng (25 ng of each complementary BiFC construct). Deep red was used as a plasma membrane marker and a reference fluorescence signal. Bar = 100 µm. B) The relative YFP/Red fluorescent signal in Ma1α‐Ma1α BiFC in response to the addition of non‐tagged Ma1β as shown in (A). Data are mean ± SE of 20 cells recorded at each ratio. C) Total internal reflection fluorescence (TIRF) trace showing two photo‐bleaching steps of Ma1α‐neoGreen protein complexes. The data are presented without subtracting the background fluorescence. D) Histogram showing the predominance of Ma1α‐neoGreen protein complexes displaying two photo‐bleaching steps. E) Percentages of the one or two photo‐bleaching steps observed for neoGreen‐tagged Ma1α protein complexes in oocyte cells co‐injected with 0%, 25%, or 50% of the total cRNA as untagged Ma1β.