
Figure 7.
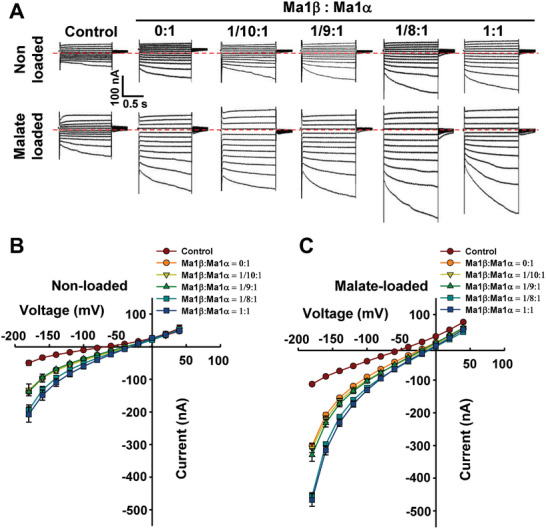
Malate transport activity in Xenopus laevis oocytes co‐expressing Ma1α and Ma1β genes in various ratios. A) Examples of currents elicited in response to holding potentials ranging from +40 to −180 mV (in 20 mV steps) recorded in control, Ma1β/Ma1α co‐expressing cells (Ma1: Ma1α = 0:1, 1/10:1, 1/9:1, 1/8:1, and 1:1, with the amount of Ma1α cRNA injected into each oocyte fixed at 25 ng), either non‐loaded or loaded with malate as in Figure 3. Zero‐current level is indicated by the red dotted line. B) I/V relationships constructed from steady‐state current recordings with non‐loaded cells such as those shown in (A). Data are mean ± SE. The number of cells recorded: Control (n = 10), 0:1 (n = 12), 1/10:1 (n = 12), 1/9:1 (n = 11), 1/8:1 (n = 17), and 1:1 (n = 10). C) I/V relationships constructed from steady‐state current recordings with malate‐loaded cells such as those shown in (A). Data are mean ± SE. The number of cells recorded: Control (n = 15), 0:1 (n = 20), 1/10:1 (n = 17), 1/9:1 (n = 12), 1/8:1 (n = 17), and 1:1 (n = 20).