
Figure 8.
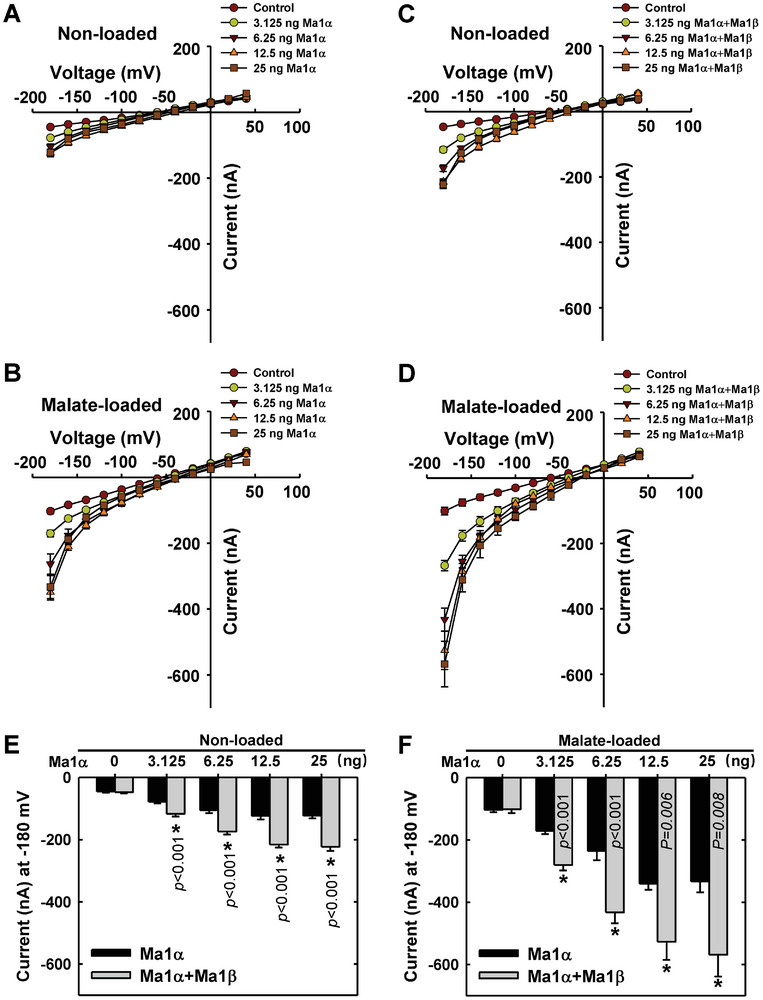
Response of malate transport activity in Xenopus laevis oocytes to the amount of Ma1α alone or co‐expressed with Ma1β at a constant ratio for synergistic interaction. A) I/V relationships constructed from steady‐state current recordings with non‐loaded oocyte cells (See Figure S9, Supporting Information) injected with various amounts of Ma1α cRNA (0–25 ng). Data are mean ± SE. The number of cells recorded for Ma1α cRNA at 0 (Control), 3.125, 6.25, 12.5, and 25 ng are 11, 16, 11, 10, and 10, respectively. B) I/V relationships constructed from steady‐state current recordings with malate‐loaded oocyte cells (Figure S9, Supporting Information) injected with various amounts of Ma1α cRNA (0–25 ng). Data are mean ± SE. The number of cells recorded for Ma1α cRNA at 0 (Control), 3.125, 6.25, 12.5, and 25 ng are 10, 13, 9, 10, and 9, respectively. C) I/V relationships constructed from steady‐state current recordings with non‐loaded oocyte cells (Figure S9, Supporting Information) co‐expressing Ma1α and Ma1β in a constant ratio of 1 to 1/8 at various amounts of Ma1α cRNA (0–25 ng). Data are mean ± SE. The number of cells recorded for Ma1α cRNA at 0 (Control), 3.125, 6.25, 12.5, and 25 ng are 12, 19, 20, 16, and 14, respectively. D) I/V relationships constructed from steady‐state current recordings with malate‐loaded oocyte cells (Figure S9, Supporting Information) co‐expressing Ma1α and Ma1β in a constant ratio of 1 to 1/8 at various amounts of Ma1α cRNA (0–25 ng). Data are mean ± SE. The number of cells recorded for Ma1α cRNA at 0 (Control), 3.125, 6.25, 12.5, and 25 ng are 11, 10, 11, 9, and 9, respectively. E) Response of currents to the amount of Ma1α cRNA in combination with Ma1β cRNA at −180 mV derived from (A) and (C). (F) Response of currents to the amount of Ma1α cRNA in combination with Ma1β cRNA at −180 mV derived from (B) and (D).