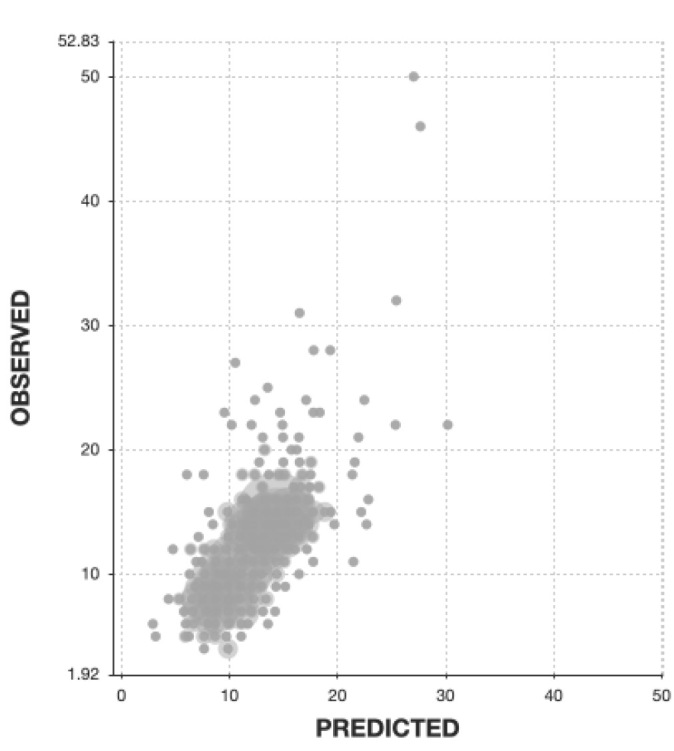
Figure 2.

Scatter plot of observed vs. predicted values for prediction of length of stay after decompression surgery for LSS by the final predictive model.
The linear correlation between predicted and measured values in the testing cohort for the top five predictive models developed was moderate (r=.576–.624).
