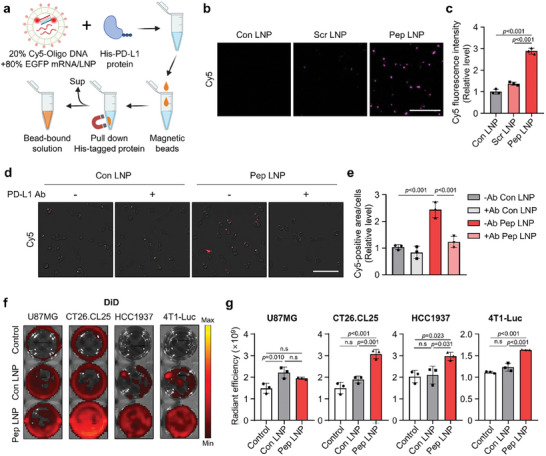
Figure 3.

PD‐L1 binding ability of Pep LNPs in vitro. a) Experimental scheme for in vitro PD‐L1 protein binding assay with Cy5‐labeled LNPs. b) Cy5 fluorescence image capturing the bead‐bound solution following incubation of Cy5‐labeled LNPs with His‐PD‐L1 protein. Scale bar: 50 µm. c) The Cy5 fluorescence intensity of bead‐bound solution. d) Cy5 fluorescence image showing the cellular binding of Cy5‐labeled Con or Pep LNPs in CT26.CL25 cells, with or without pre‐treatment of PD‐L1 antibody. Scale bar: 100 µm. e) Quantification of cellular binding assessed by measuring the Cy5‐positive area normalized to the number of cells. f) Well plate images and g) quantification of DiD radiant efficiency in cells treated with DiD‐labeled Luc/Con or Pep LNPs. All data presented as mean ± SD, n = 3. n.s, not significant; c,e,g) One‐way ANOVA with Tukey's post‐hoc test.
