Figure 4.

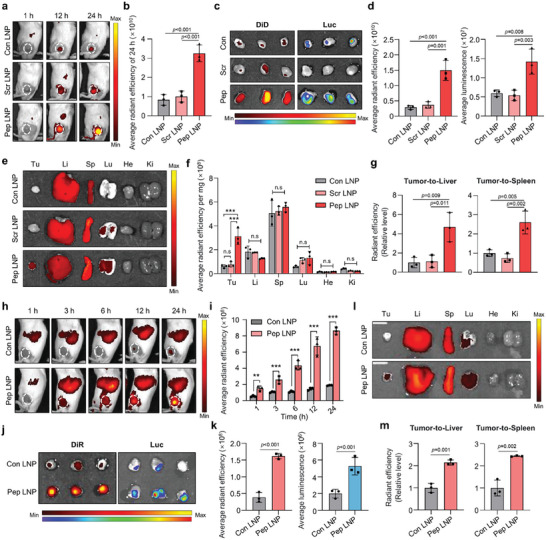
PD‐L1‐high tumor‐targeting of Pep LNPs. a) DiD fluorescence imaging of CT26.CL25 subcutaneous BALB/c mouse model after intravenous injection of DiD‐labeled Luc/Con, Scr, or Pep LNPs (Normalization was performed together for 1 h and 12, 24 h). b) The quantification of tumor‐localized average radiant efficiency of 24 h. c) Fluorescence and luminescence image of tumors harvested at 24 h post‐injection. d) The average radiant efficiency and luminescence of harvested tumors. e) DiD fluorescence imaging of harvested organs and f) quantified graphs of organ DiD radiant efficiency normalized to organ weight (mg). g) Quantified graphs of tumor DiD radiant efficiency normalized to that of the liver or spleen. h) DiR fluorescence imaging and i) quantification of in vivo tumor localized radiant efficiency after intravenous injection of DiR‐labeled Luc/Con or Pep LNPs in BALB/c mice bearing 4T1 tumor. j) DiR fluorescence or luminescence imaging and k) quantification of tumors harvested at 24 h postinjection. l) DiR fluorescence imaging of harvested organs and m) quantification of tumor DiR radiant efficiency with normalized to that of liver or spleen. Li: liver, Sp: spleen, Lu: lung, He: heart. Ki: kidney, Tu: tumor. All data presented as mean ± SD, n = 3. n.s, not significant; **p < 0.01, ***p < 0.001. b,d,g) One‐way ANOVA with Tukey's post‐hoc test, f, i) Two‐way ANOVA with Tukey's post‐hoc test. k,m) Unpaired t‐test.
