Figure 6.

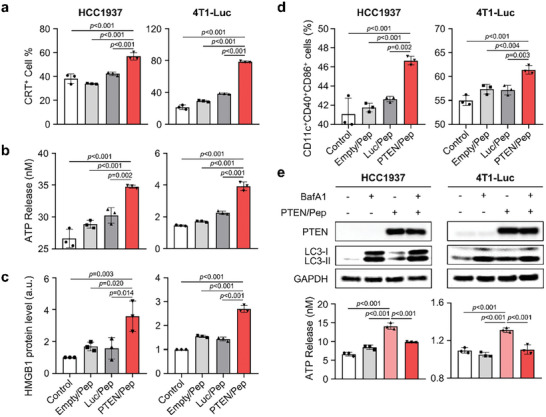
PTEN/Pep LNP‐mediated ICD and DC maturation in TNBC. a–c) Analysis of ICD markers in HCC1937 and 4T1‐Luc cells 24 h (CRT) or 48 h (ATP and HMGB1) after treatment with different LNPs. a) CRT expression on the cell surface was evaluated by flow cytometry. b) Extracellular ATP release was measured by an ATP bioluminescence detection kit. c) Extracellular HMGB1 level was evaluated by western blot analysis. d) BMDCs were added with supernatants from HCC1937 and 4T1‐Luc cells, which had been treated with Empty/Pep LNPs, Luc/Pep LNPs, PTEN/Pep LNPs, or left untreated for 48 h. Then, the percentage of matured DCs (CD11c+CD40+CD86+) was analyzed by flow cytometry. e) HCC1937 and 4T1‐Luc cells were either untreated or treated with PTEN/Pep LNPs for 24 h. Cells were then exposed to BafA1 or left untreated for an additional 12 h before undergoing western blot analysis and extracellular ATP release assay. All data presented as mean ± SD, n = 3. a–e) One‐way ANOVA with Tukey's post‐hoc test.
