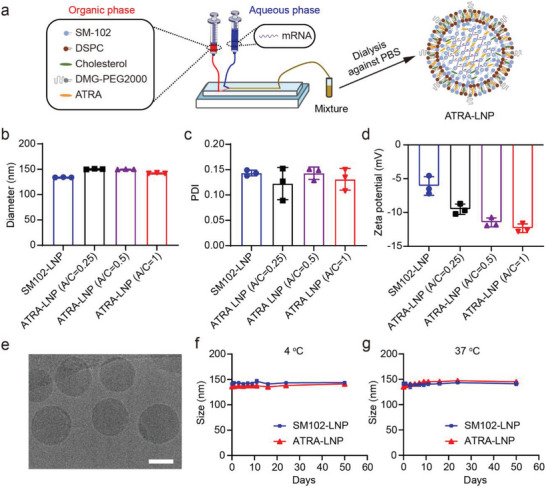
Figure 2.

a) Schematic representation of the preparation process of ATRA‐LNP. The hydrodynamic diameters b), polydispersity indexes (PDI) c), and zeta potentials d) of ATRA‐LNP containing different amounts of ATRA. A/C represents the molar ratio of ATRA to cholesterol. SM102‐LNP without ATRA was used as a control. e) A representative cryo‐EM image of ATRA‐LNP. The scale bar is 50 nm. f and g) The hydrodynamic diameters of ATRA‐LNP and SM102‐LNP after storage a 4 and 37 °C. Data are shown as mean ± SD (standard deviation). n = 3 technical replicates.
