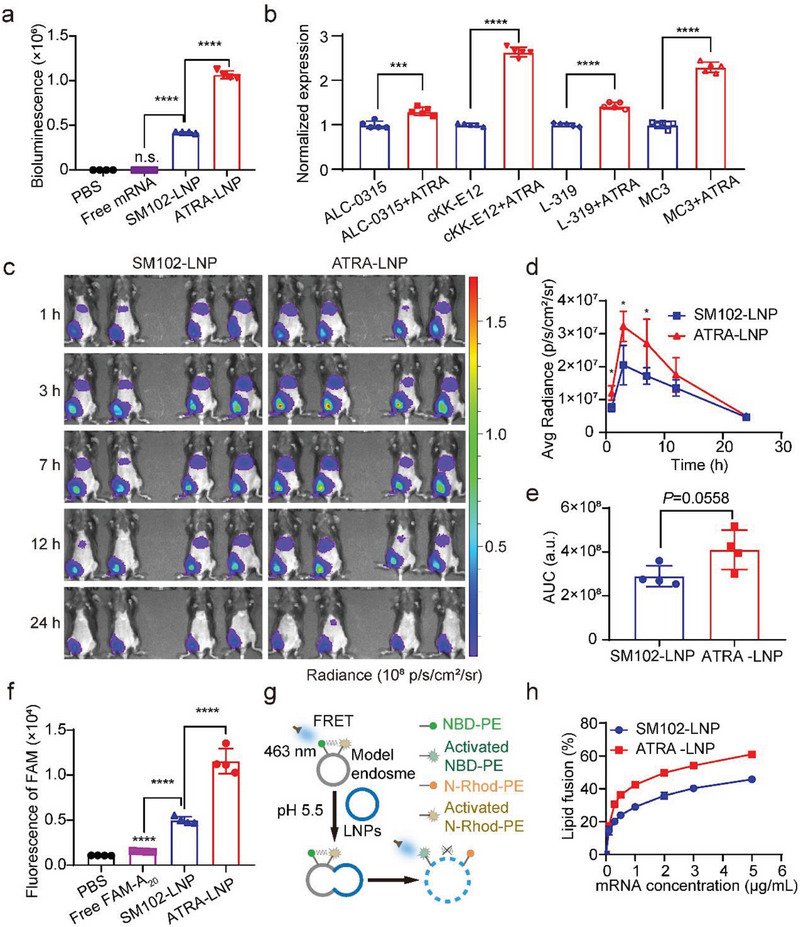
Figure 3.

a) Transfection efficiency of free mRNA, SM102‐LNP, and ATRA‐LNP (N/P = 15) in DC2.4 cells (n = 4). b) Transfection efficiency of LNPs that are formulated with different ionizable lipids (N/P = 15) in DC2.4 cells (n = 5). c) IVIS images of mice receiving intramuscular injections of PBS, SM102‐LNP, or ATRA‐LNP (1 µg of mLuc per mouse, n = 4 biologically independent samples). d and e) Quantification of bioluminescence signals of mice and the area under the curve of luminescence signals over time (n = 4 biologically independent samples). f) Flow cytometry analysis of DC2.4 cells treated with free FAM‐A20, FAM‐A20‐loaded SM102‐LNP, or ATRA‐LNP (n = 4). g) Schematics view of the membrane fusion assay using fluorescence resonance energy transfer (FRET). h) The fusion of SM102‐LNP or ATRA‐LNP with model endosomes at different mRNA concentrations at pH 5.5 (n = 4). Data are shown as mean ± SD. Statistical analysis was calculated using the unpaired two‐tailed Student's t‐test b and e), one‐way analysis of variance (ANOVA) (a and f), or two‐way ANOVA d) with Tukey's multiple comparisons test: * p < 0.05, ** p <0.01, *** p <0.001, **** p <0.0001, n.s. represents not statistically significant.
