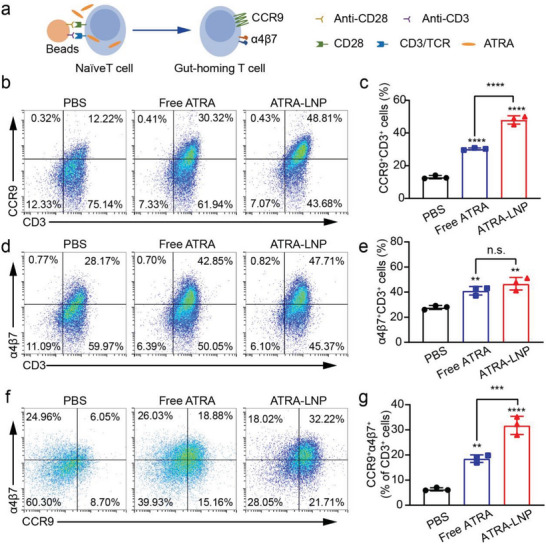
Figure 4.

a) Schematic view of the in vitro T cell activation assay. Isolated CD8+ T cells from the spleen of mice were activated by anti‐CD3/CD28 antibodies‐coated beads. ATRA‐LNP in PBS or free ATRA in DMSO were incubated with T cells during activation. The expressions of CCR9 and α4β7 were quantified by flow cytometry. Representative flow cytometry plots and quantification analysis of CCR9+CD3+ T cells (b and c), α4β7+CD3+ T cells d and e), and CCR9+α4β7+CD3+ T cells f and g). n = 3 technical replicates. Data are shown as mean ± SD. Statistical analysis was calculated using one‐way ANOVA and Tukey's multiple comparisons tests: ** p <0.01, *** p <0.001, **** p <0.0001, n.s. represents not statistically significant.
