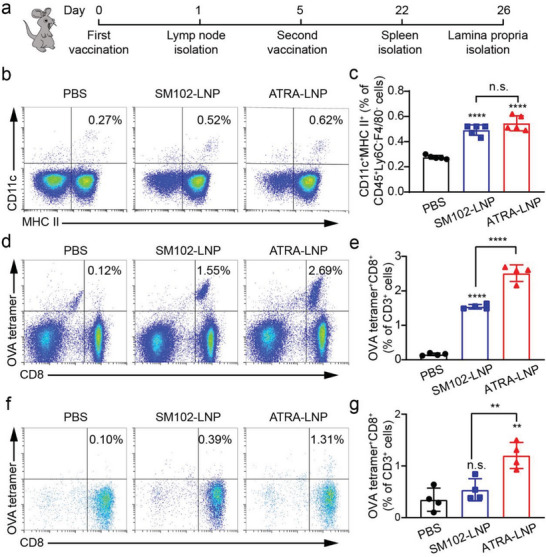
Figure 5.

a) Schematic of vaccination regimen on C57BL/6 mice. Mice were vaccinated through intramuscular injections at days 0 and 5. The draining lymph nodes, spleens, and intestine lamina propria were isolated for flow cytometry analysis on days 1, 22, and 26, respectively. Representative flow cytometry plots and quantification of activated DCs b and c) in the draining lymph nodes (n = 5 biologically independent samples), OVA tetramer+CD8+ T cells d and e) in the spleen, and OVA tetramer+CD8+ T cells (f and g) in the intestine lamina propria (n = 4 biologically independent samples) after different treatments. Data are shown as mean ± SD. Statistical analysis was performed using one‐way ANOVA and Tukey's multiple comparisons tests: ** p <0.01, **** p <0.0001, n.s. represents not statistically significant.
