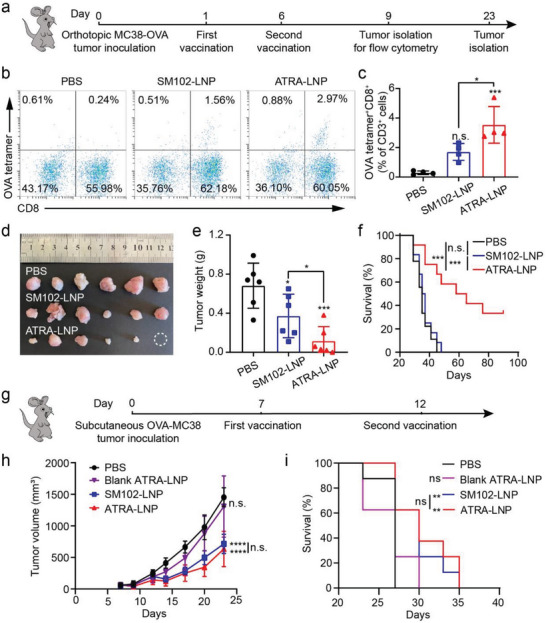
Figure 6.

a) Treatment scheme of an orthotopic MC38‐OVA colorectal tumor model using mOVA‐loaded LNPs. b and c) Representative flow cytometry plots and quantification of OVA tetramer+CD8+ T cells in the tumors after different treatments (n = 4 biologically independent samples). Statistical significance was calculated by one‐way ANOVA and Tukey's multiple comparisons test. d and e) Photographs and weights of isolated tumors (n = 6 biologically independent samples). Statistical significance was calculated by unpaired two‐tailed Student's t‐test. f) Kaplan–Meier survival curves of mice after different treatments (n = 9 – 12 biologically independent samples per group). g) Treatment scheme of a subcutaneous MC38‐OVA colorectal tumor model. h and i) Average tumor growth and Kaplan–Meier survival curves of tumor‐bearing mice after different treatments (n = 8 biologically independent samples). Data are shown as mean ± SD. Statistical significance was calculated by two‐way ANOVA and Tukey's multiple comparisons test: * p < 0.05, ** p <0.01, *** p <0.001, **** p <0.0001, n.s. represents not statistically significant.
