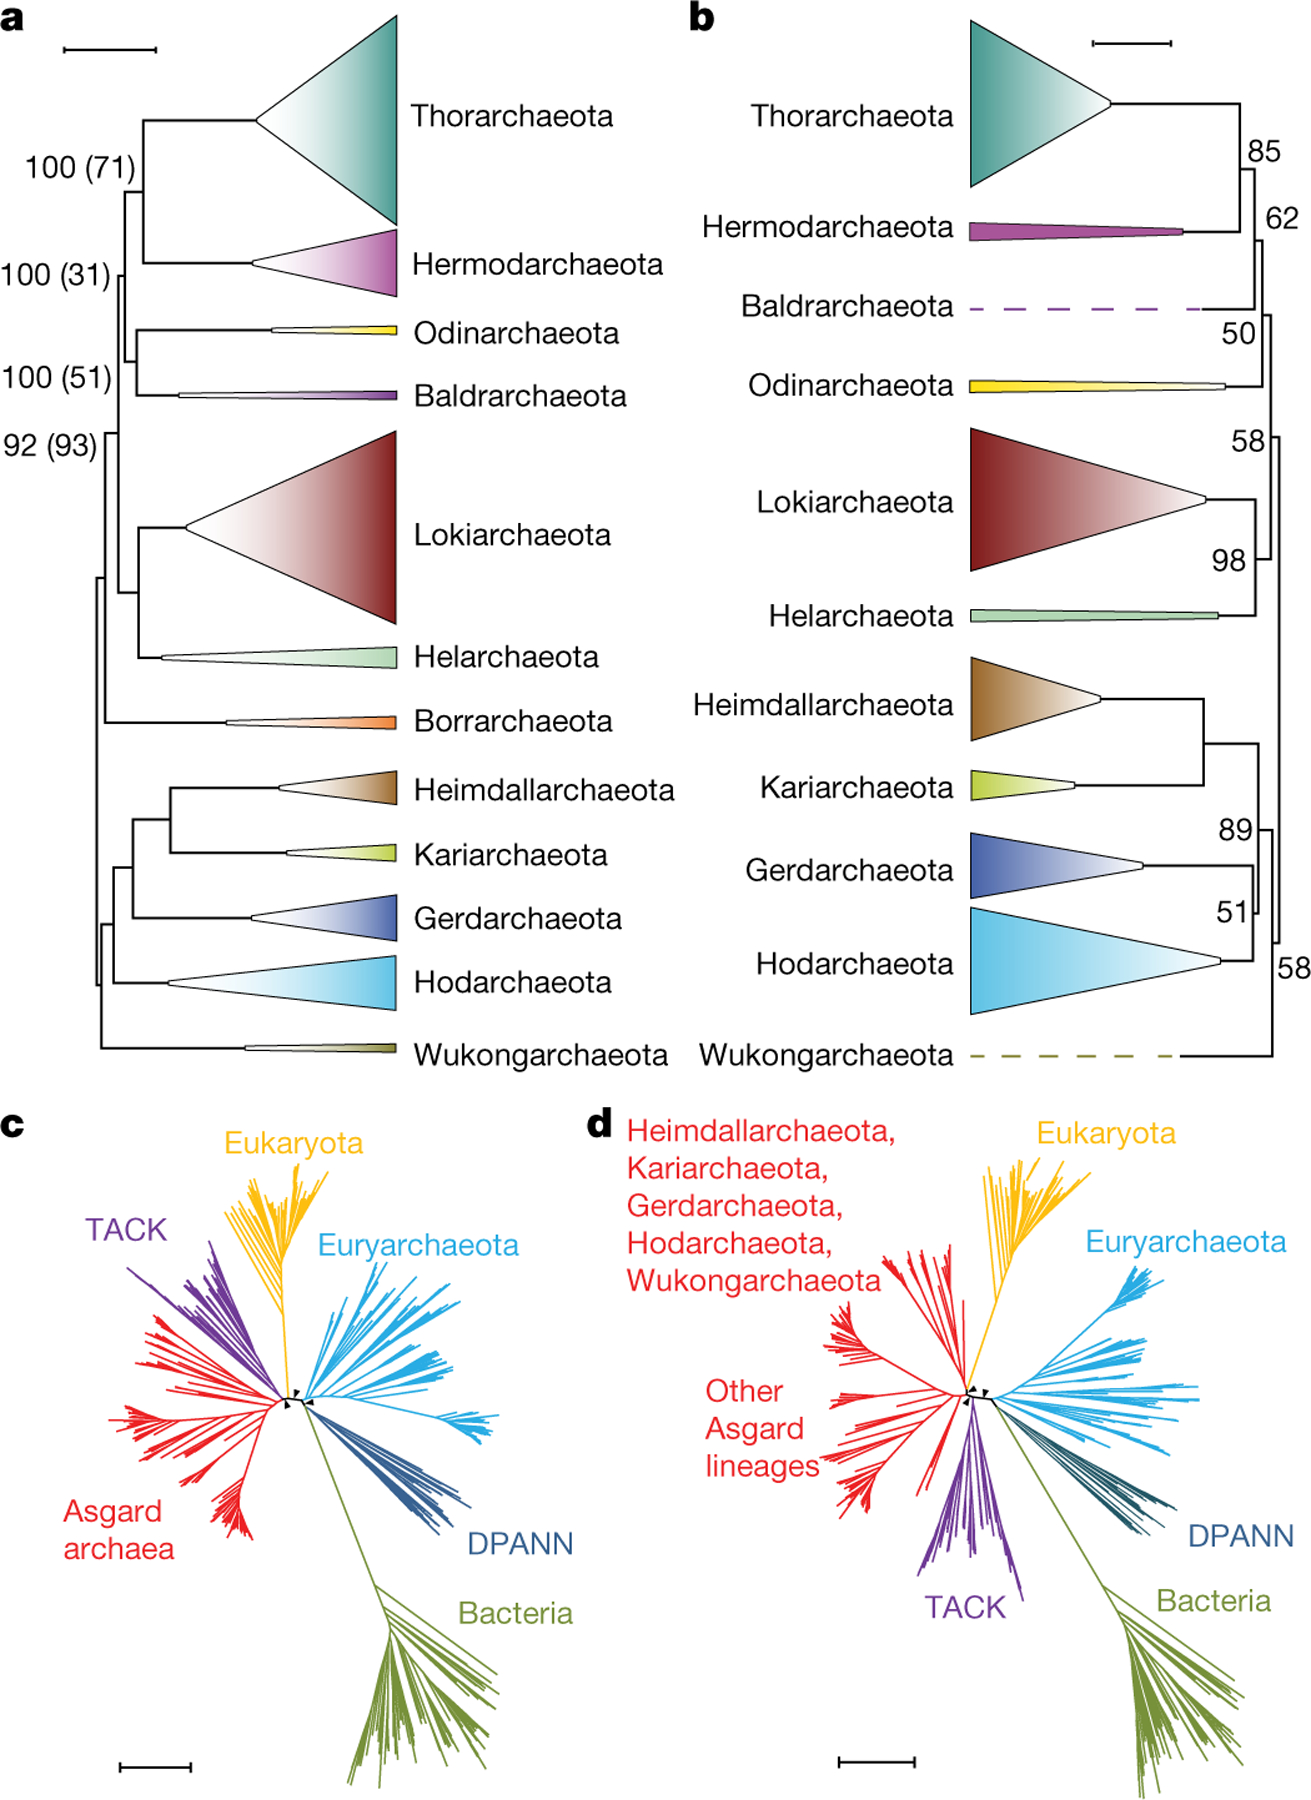
Fig. 1 |. Phylogenetic analysis of Asgard archaea and their relationships with eukaryotes.

a, Maximum likelihood tree (inferred with IQ-tree and the LG + F + R10 model) constructed from the concatenated alignments of the protein sequences from 209 core Asgard COGs. Only the 12 phylum-level clades are shown (species within each clade are collapsed) (Methods, Supplementary Table 5). Support values in parentheses indicate the frequency of the corresponding bipartition among 100 bootstrap-like samples of the 209 core Asgard COGs; where these are not indicated, both support values were 100. The root position was inferred from the global tree (c). Scale bar, 0.5 average amino acid substitutions per site. b, Maximum-likelihood tree (inferred with IQ-tree and the GTR + F + G model) on the basis of 16S rRNA gene sequences. Support values (percentage points) are indicated for 1,000 ultrafast bootstrap samples only for values that are less than 100. The root position was inferred from the global tree (c). Scale bar, 0.2 average nucleotide substitutions per site. c, Phylogenetic tree of bacteria, archaea and eukaryotes (inferred with IQ-tree under the LG + R10 model) constructed from the concatenated alignments of the protein sequences the correspond to 29 universally conserved genes, excluding COG0012 (Methods). The tree shows the relationships among the major clades. The tree is unrooted and is shown in a pseudorooted form for visualization purposes only. The arrowheads indicate 100 bootstrap support. DPANN, Diapherotrites, Parvarchaeota, Aenigmarchaeota, Nanoarchaeota and Nanohaloarchaeota. d, The consensus topology of 129 trees of bacteria, archaea and eukaryotes, constructed from the concatenated protein sequence alignments of bootstrap-like samples and leave-one-out sets of the of 29 universally conserved markers, excluding COG0012 (Methods). The tree shows the relationships between the major clades; tree branch lengths and support values are derived from the full 29-marker alignment; the arrowheads indicate 100 bootstrap support. The tree is unrooted and is shown in a pseudorooted form for visualization purposes only. The complete trees and alignments are in supplementary data file 2; lists of the trees are provided in Supplementary Tables 4, 5. Scale bars, 0.5 average amino acid substitutions per site (c, d).
