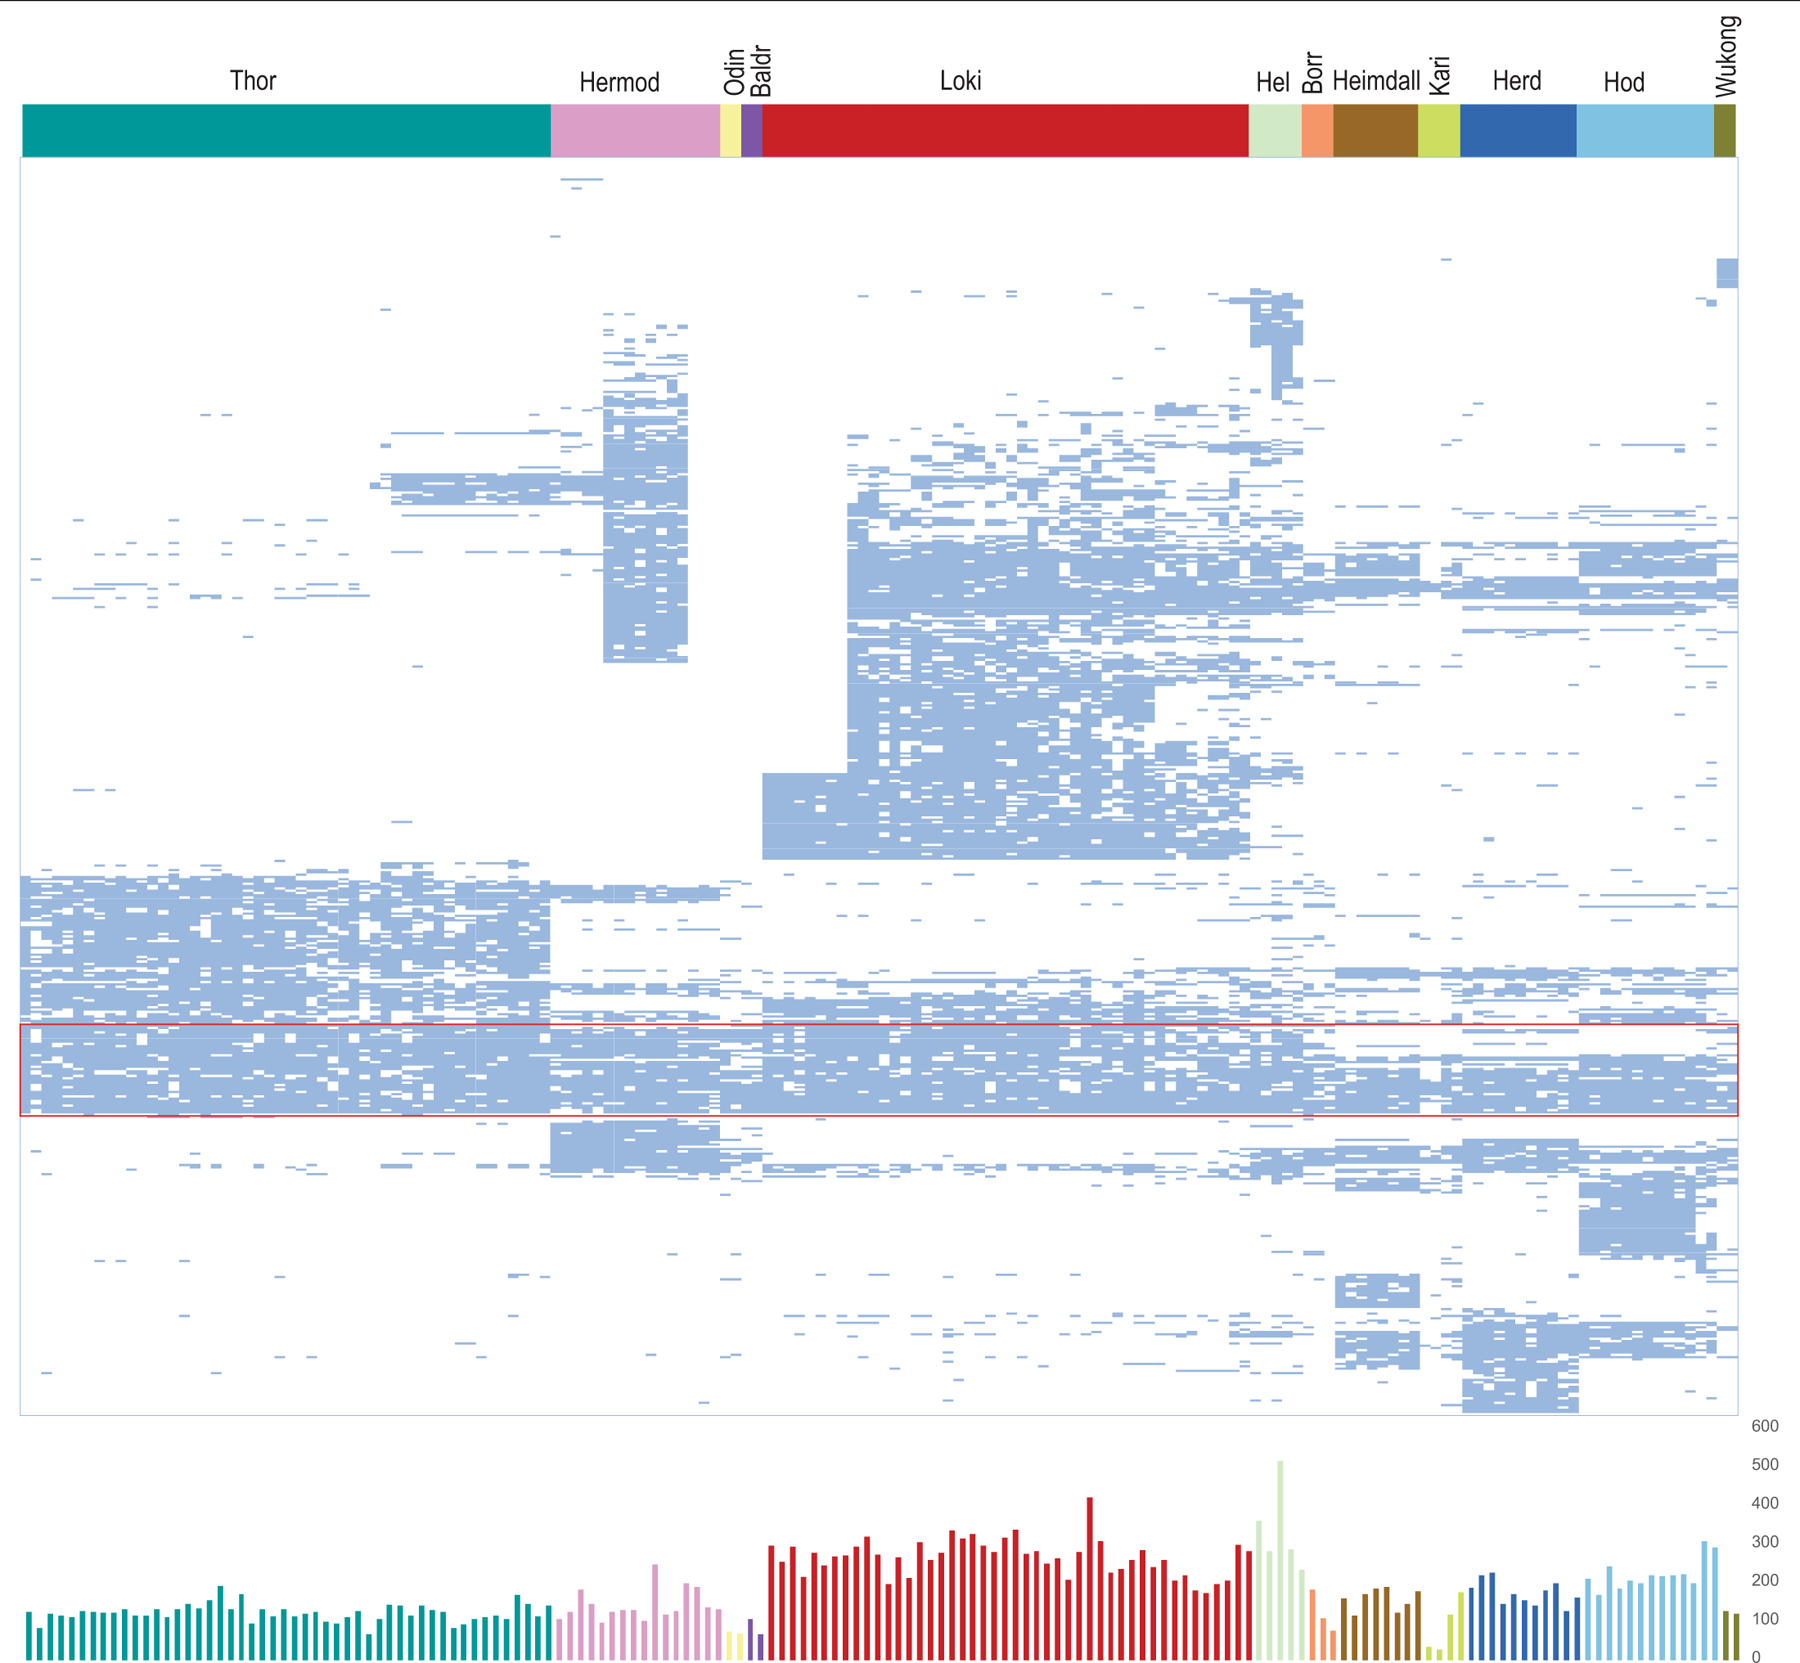
Extended Data Fig. 8 |. Phyletic patterns of ESPs in Asgard genomes.

All 505 Asgard COGs that correspond to ESP are grouped by distance between binary presence–absence phyletic patterns. For a given pair of Asgard COGs A and B that are present in the set of genomes {GA} and {GB}, respectively, we calculate the similarity between the patterns as SA,B = |{GA} × {GB}|/|{GA}+{GB}|, and the distance between the patterns as DA,B = −ln(SA,B). A dendrogram was reconstructed using the unweighted-pair group method with arithmetic mean, from the distance matrix D; the order of leaves in the tree determines the order of Asgard COGs in the figure. Top, patterns are shown schematically by pale blue lines, in which the respective Asgard COG is present and mapped to the 12 major Asgard lineages (as shown by the coloured bar above). The Asgard COGs that correspond to the most highly conserved ESP protein families are shown within the red rectangle. Bottom, plot of the number of Asgard COGs that correspond to ESPs in each of 76 genomes is shown. Complete data are provided in Supplementary Table 7. The colour code for the plot is the same as for the bar graph.
