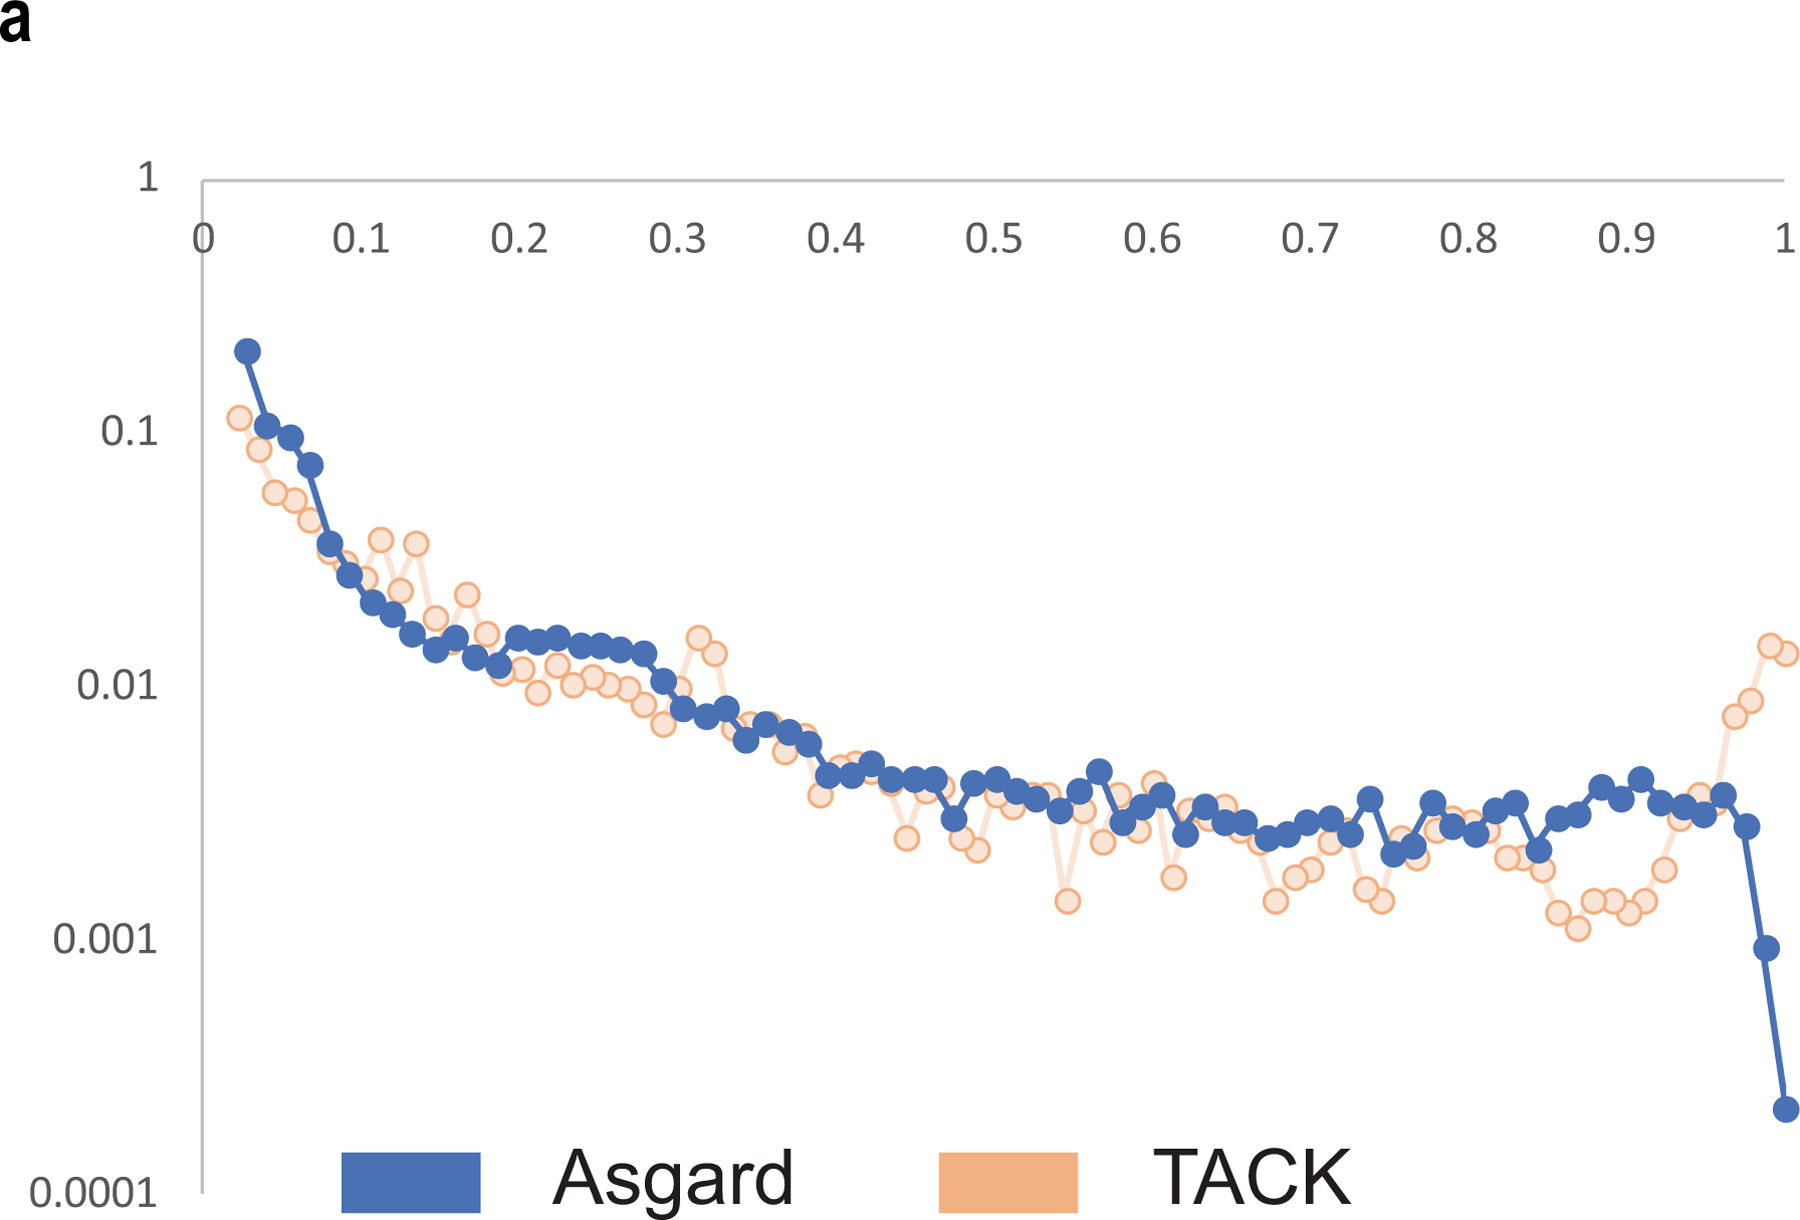
Extended Data Fig. 3 |. Gene commonality plot for Asgard archaea and the TACK superphylum.

Gene commonality plot showing the number of Asgard COGs (log scale) (y axis) that include the given fraction of analysed genomes (x axis). The Asgard plot is compared with the TACK superphylum plot on the basis of the assignment of TACK geznomes to archaeal COGs.
