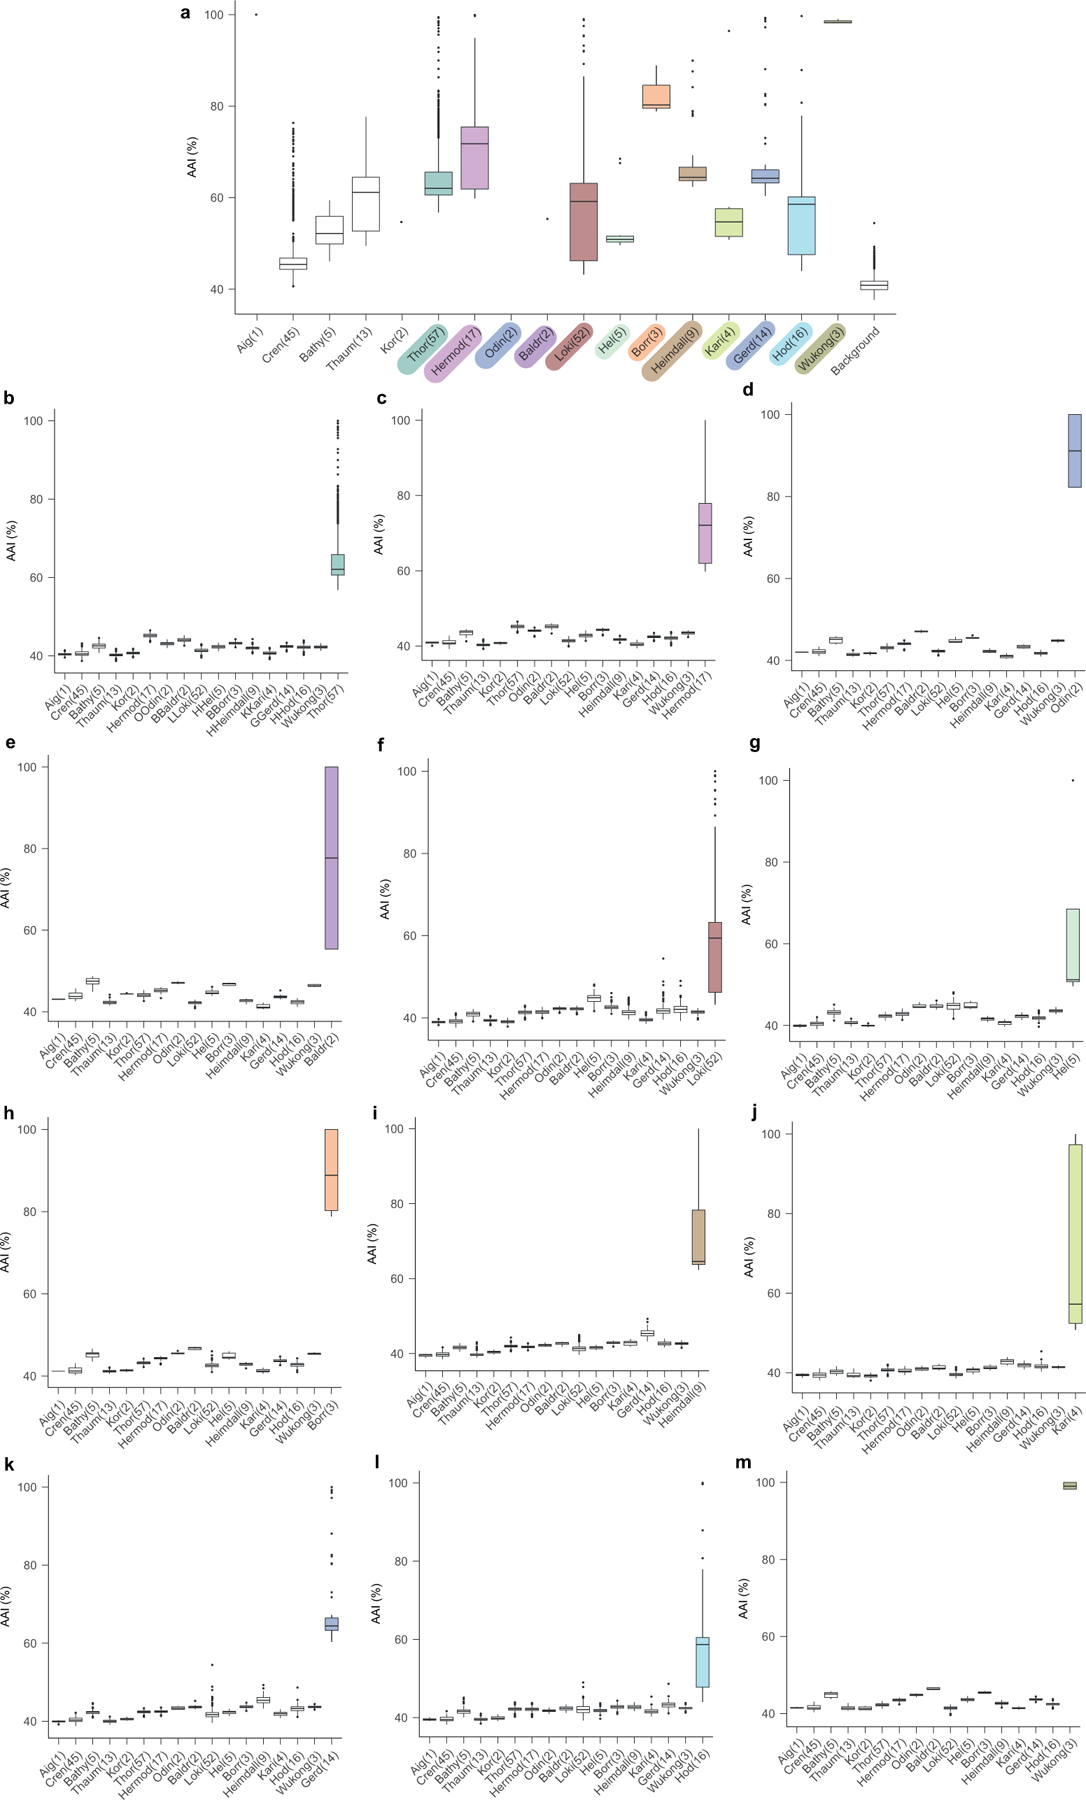
Extended Data Fig. 4 |. Comparison of the mean amino acid identity of Asgard and TACK superphyla.

In this figure, -archaeota is omitted from the phylum names. Sample sizes of less than three are presented as individual points. a, Shared amino acid identity across Asgard and TACK lineages. Comparison of representative genomes from all Asgard and TACK lineages analysed in this Article (excluding the six putative phyla proposed in this Article), which characterizes the distribution of amino acid identities that is typical of a phylum. b–m, Amino acid identity comparisons between Thorarchaeota (b), Hermodarchaeota (c), Odinarchaeota (d), Baldrarchaeota (e), Lokiarchaeota (f), Helarchaeota (g), Borrarchaeota (h), Heimdallarchaeota (i), Kariarchaeota ( j), Gerdarchaeota (k), Hodarchaeota (l) and Wukongarchaeota (m) and other Asgard and TACK lineages. Thick black bar, median; upper and lower bounds of the box plot, first and third quartile respectively; upper and lower whiskers, largest and smallest values less than 1.5× interquartile range, respectively; black points, values greater than 1.5× interquartile range; number in the parentheses, number of genomes in the lineage. Data for this plot are given in Supplementary Table 2.
