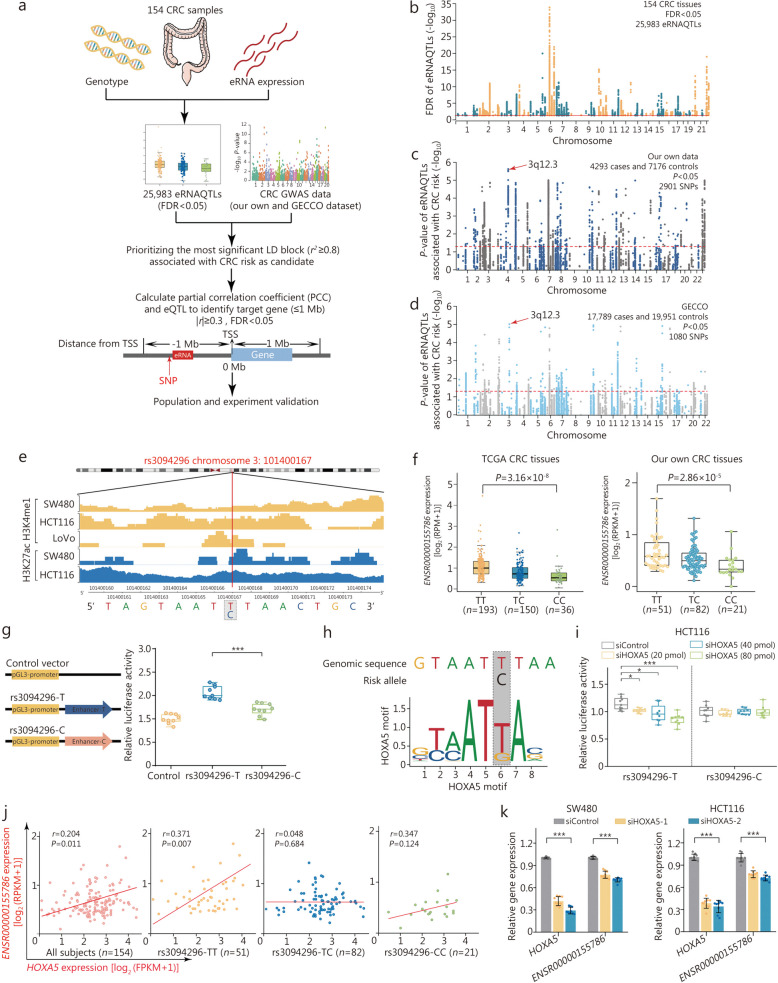
Fig. 5.
eRNAQTL rs3094296 promotes eRNA ENSR00000155786 expression mediated by TF HOXA5. a Workflow to identify the candidate variant by integrating eRNAQTL analysis and CRC GWAS data, the target gene was selected by combining co-expression analysis and eQTL result in CRC. b Manhattan plot of eRNAQTL results in 154 CRC samples. The red line shows the FDR < 0.05 threshold. c Manhattan plot for associations between eRNAQTLs and CRC risk from the Chinese population consisting of 4293 cases and 7176 controls. d Validation in European populations from GECCO, with a combined sample size of 17,789 cases and 19,951 controls. P-values were calculated by an unconditional logistical regression analysis with an additive model adjusting for gender, age, smoking, and drinking status. P < 0.05 was considered statistically significant (indicated by the red line). e Epigenetic tracks obtained from the Cistrome database show the enrichment of enhancer markers (H3K4me1 and H3K27ac peaks) in the rs3094296 region. f eRNAQTL analysis demonstrates the correlation between the rs3094296 genotype and the expression of ENSR00000155786 in the TCGA CRC samples and our own CRC tissues. Data were shown as the median (minimum to maximum). g Relative reporter gene activity of the vectors containing the rs3094296-T or rs3094296-C allele in HCT116 cell. h The rs3094296-T allele resides within the HOXA5 binding motif. i The effect of HOXA5 knockdown on the relative luciferase activity of vectors containing the rs3094296-T or rs3094296-C allele in HCT116 cell. Data were presented as the median (minimum to maximum) from three repeated experiments, each has three technical replicates. P-values were calculated by a two-sided Student’s t-test. j Scatter plots show the correlations between HOXA5 and ENSR00000155786 expression in our CRC tumor tissues and stratified by SNP rs3094296 genotype. All P-values and correlation coefficients were calculated by Spearman’s correlation analysis. k Histogram displays the effect of HOXA5 knockdown on the expression of ENSR00000155786 in SW480 and HCT116 cells. Data were presented as the mean ± SD from three repeated experiments with three technical replicates. All P-values were calculated using a two-sided Student’s t-test. *P < 0.05, ***P < 0.001. CRC colorectal cancer, FDR false discovery rate, GECCO Genetics and Epidemiology of Colorectal Cancer Consortium, LD linkage disequilibrium, FPKM fragments per kilobase of exon model per million mapped fragments, RPKM reads per kilobase per million mapped reads, HOXA5 homeobox A5, SD standard deviation

