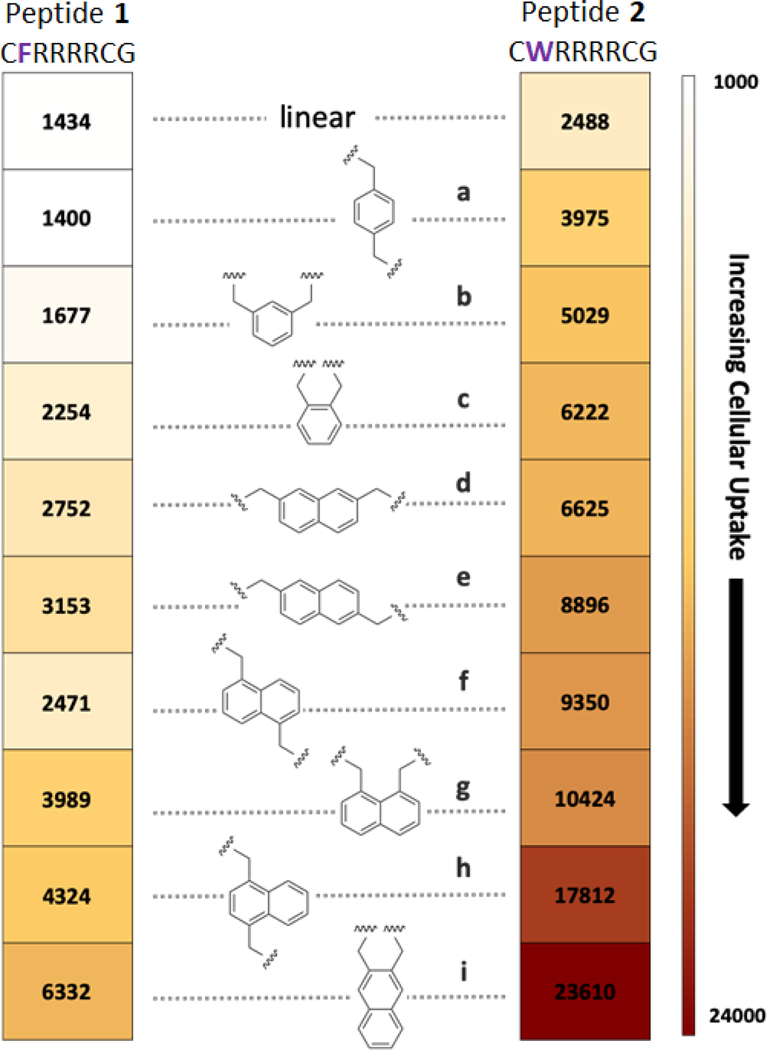
Figure 3: Cellular uptake experiments.
Peptides are arranged from low (top) to high (bottom) permeability in MDA-MB 231 cells as measured by flow cytometry. Each peptide was incubated at a concentration of 5 µM for 2 h. The numbers in the boxes signify the mean fluorescence for cells incubated with that peptide.

