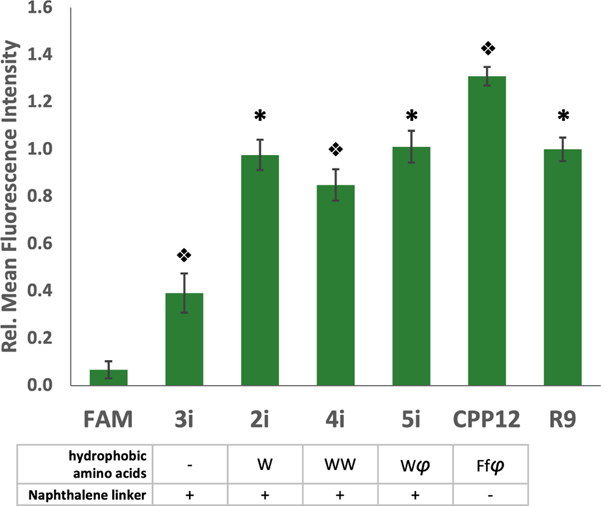
Figure 4: Hydrophobicity enhances uptake.
Relative fluorescence intensity of peptides with various hydrophobic groups compared to R9 and the reported peptide, CPP12. Each peptide was incubated with MDA-MB 231 cells at a concentration of 5 µM for 2 h. Error bars represent the standard deviation of three independent experiments. φ = 2-naphthylalanine, f = D-phenylalanine. * indicates significant difference from all other peptides except 2i, 5i, or R9 p<0.001. Split diamonds indicate differences from all other conditions p<0.01, 1-way ANOVA, Tukey.

