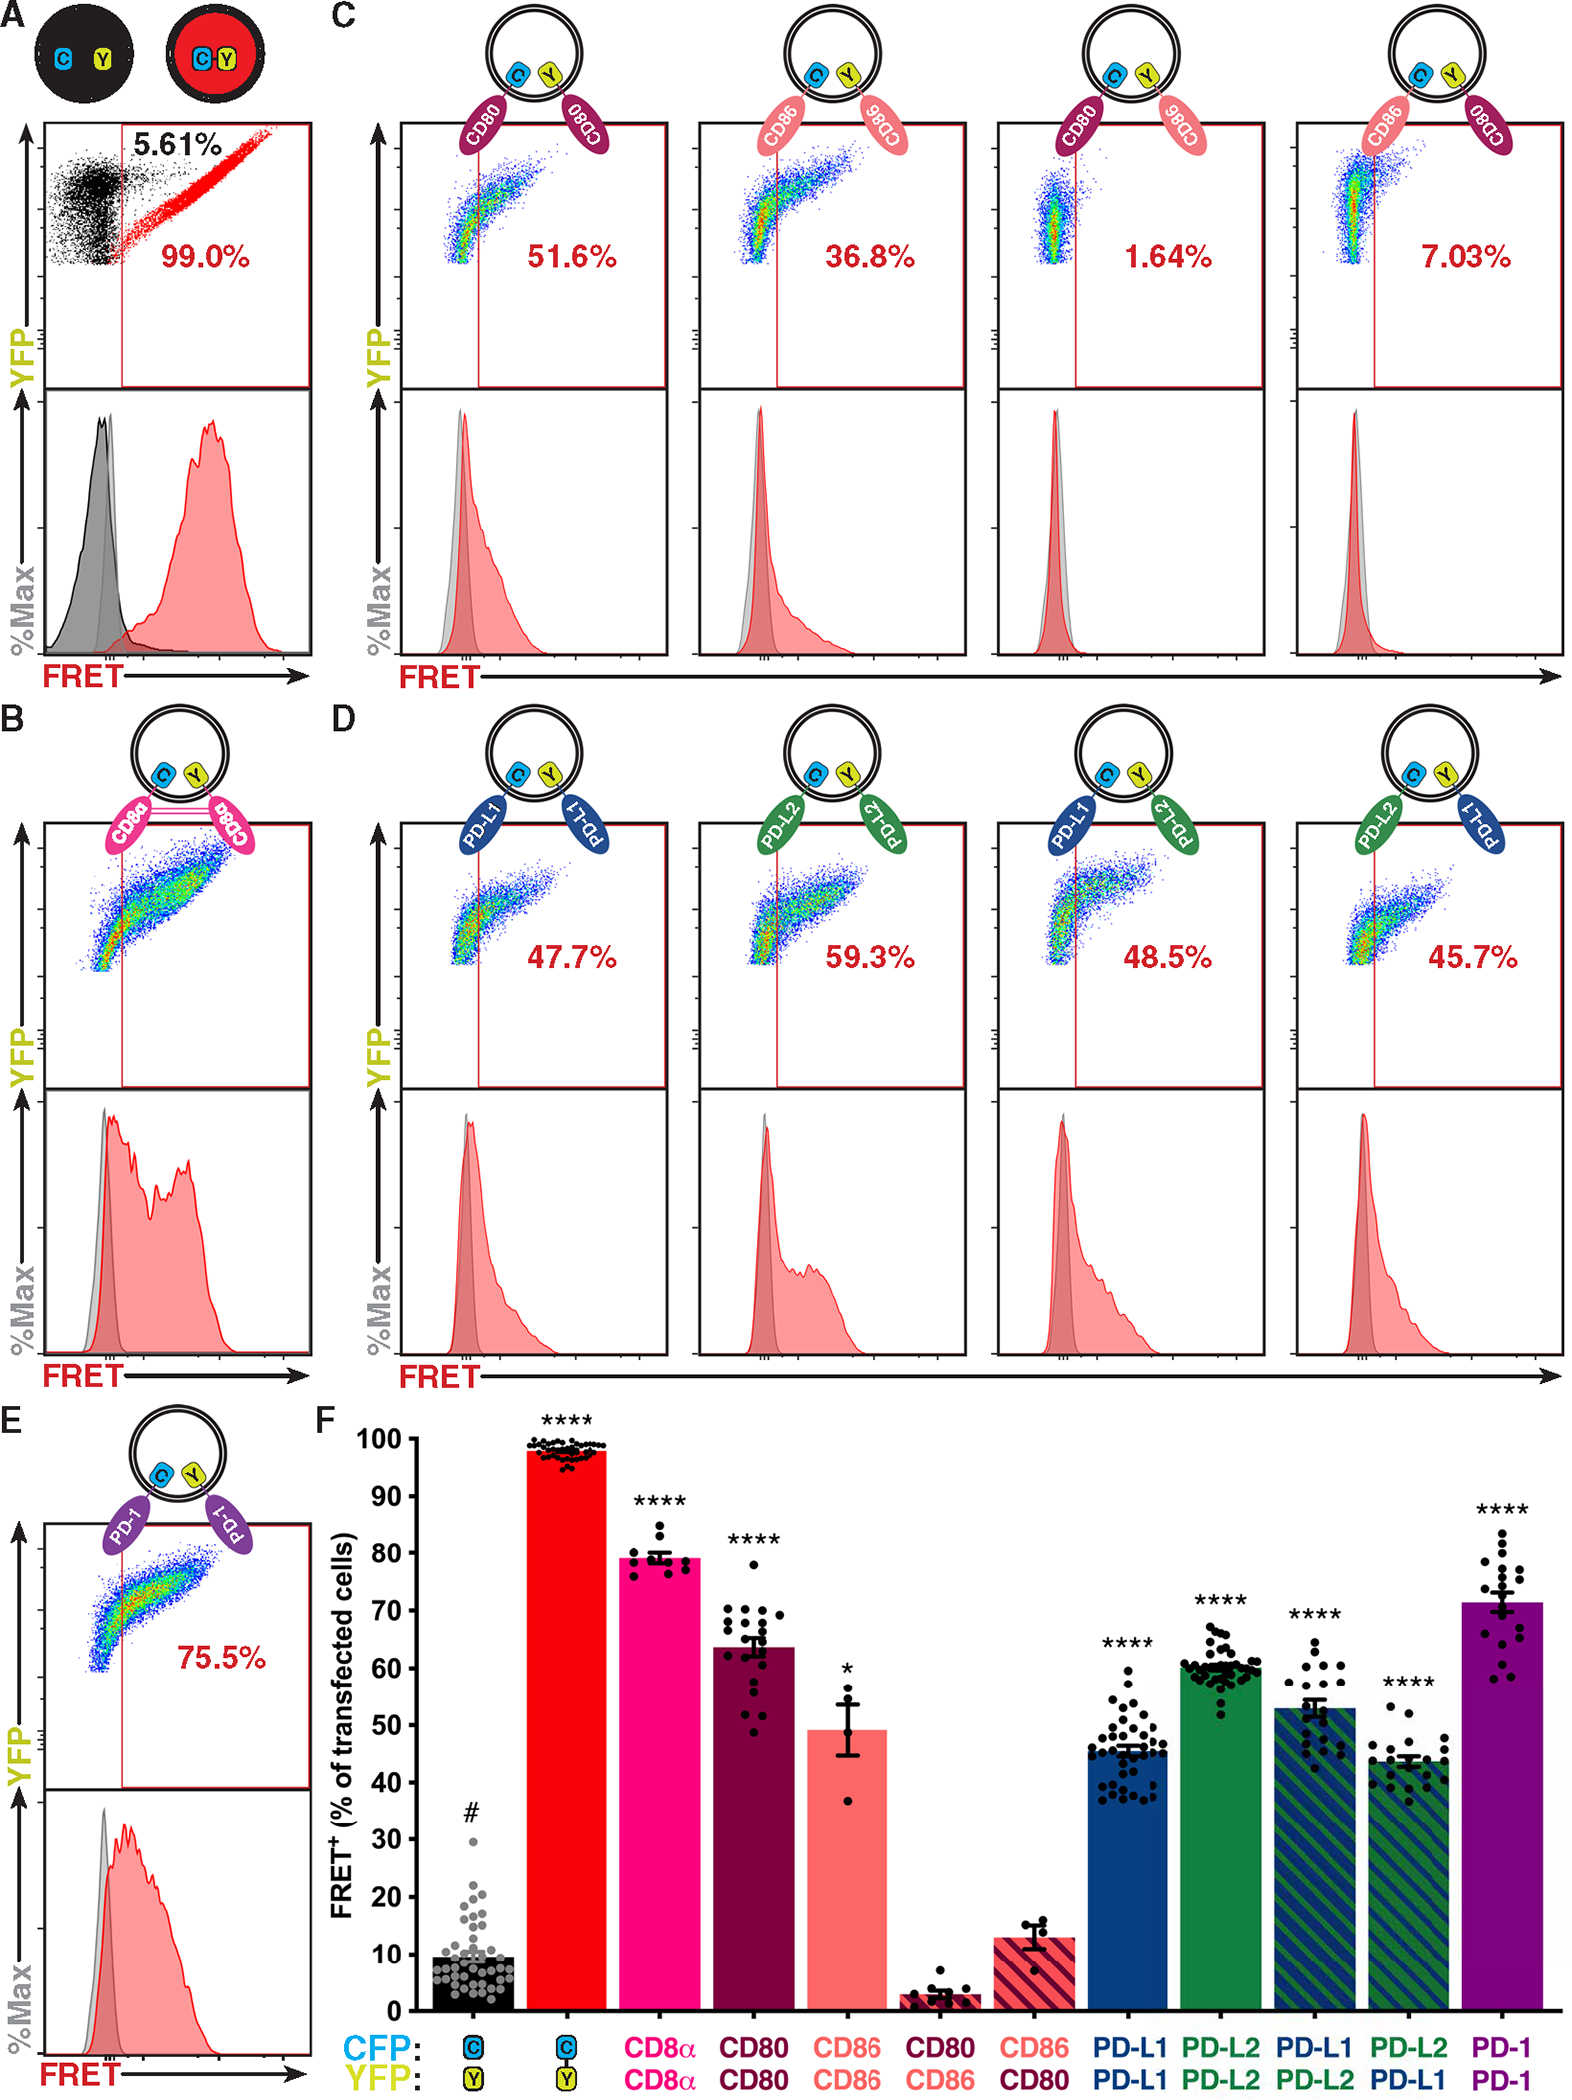
Fig. 1. PD-1 and its ligands dimerize in cis.

(A to E) Flow-FRET analysis of immune receptors expressed in CHO cells as CFP or YFP fusion proteins as depicted above each panel. FRET was determined with gates described in fig. S1A and shown as a representative scatterplot (YFP versus FRET) and histogram (events versus FRET). (A) Controls for minimum (CFP and YFP coexpressed, black) and maximum (CFP fused to YFP, red) flow-FRET. (B) CD8α flow-FRET pair. (C) CD80 and CD86 homo– and hetero–flow-FRET pairs for validation. (D) PD-L1 and PD-L2 homo– and hetero–flow-FRET pairs. (E) PD-1 flow-FRET. (F) Cumulative flow-FRET data (n ≥ 3) displayed as the percent of FRET+ transfected cells ± SEM. Significance shown as paired t tests versus negative control (#): *P < 0.05 and ****P < 0.0001.
