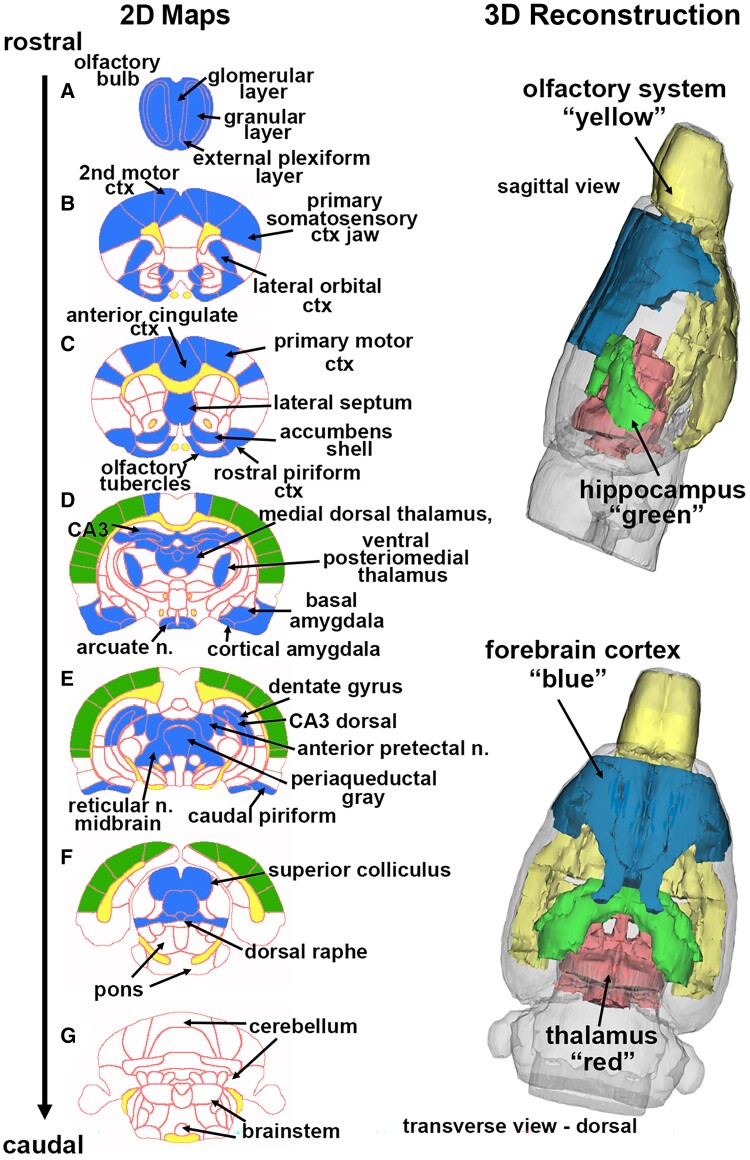
Figure 1.
Change in BOLD signal with high-dose LSD. Depicted are 2D coronal sections A–G showing the location of brain areas that were significantly different in negative BOLD signal (blue highlight) between Veh and high-dose (100 µg/kg) LSD. White matter tracts are highlighted in yellow. The primary SS, auditory and visual cortices that were not significantly affected are shown in green. The 3D colour-coded reconstructions summarize the major brain areas that were significantly different. n., nucleus.

