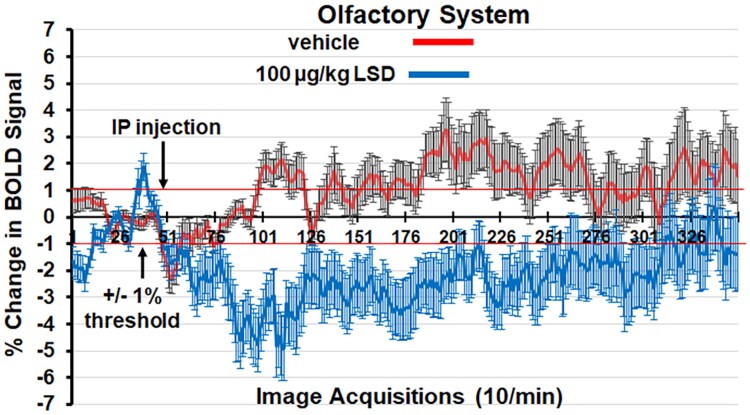
Figure 2.
Change in BOLD signal over time. Shown is the change in BOLD signal over time for the olfactory system in response to Veh (red line) and 100 µg/kg of LSD (blue line). Three hundred fifty images were acquired over the 35-min imaging session. Each acquisition is the mean ± Se of Veh and high-dose LSD rats combining the data from the three layers of the olfactory bulb, rostral and caudal piriform cortex and olfactory tubercles for all subjects for each experimental condition. The 1% threshold is highlighted by the red lines to account for the normal fluctuations in BOLD signal in the awake rat brain. A two-way ANOVA showed a significant time × treatment interaction, F = 4.424, P < 0.0001. IP, intraperitoneal.

