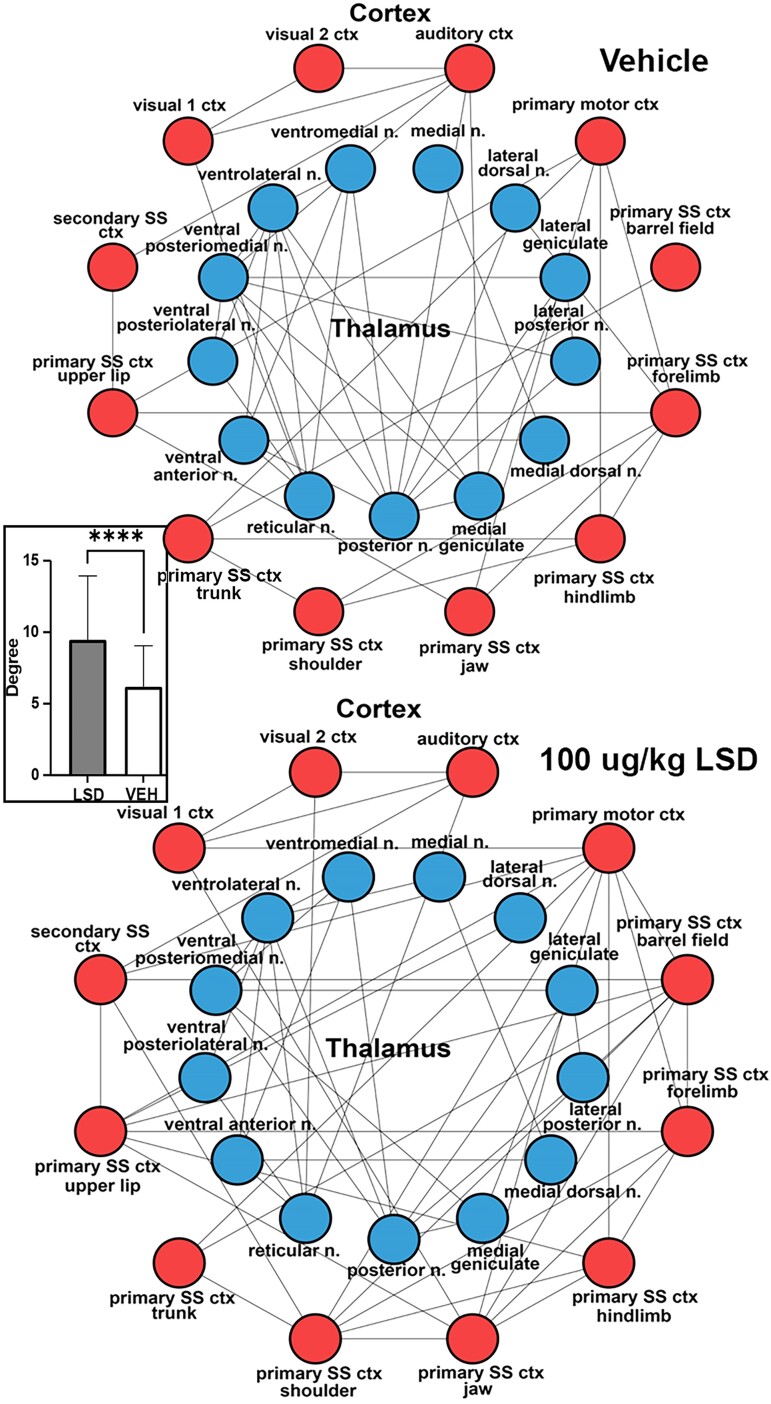
Figure 3.
Thalamo-cortical connectivity. Shown are radial representations of the connections or degrees (lines) between thalamic nuclei (blue circles) and SS, visual and auditory cortices (red) for Veh and LSD treatments. The insert are bar graphs (mean ± Sd) for the number of degrees between LSD and Veh. Student’s t-test, ****P < 0.0001. SS, somatosensory.

