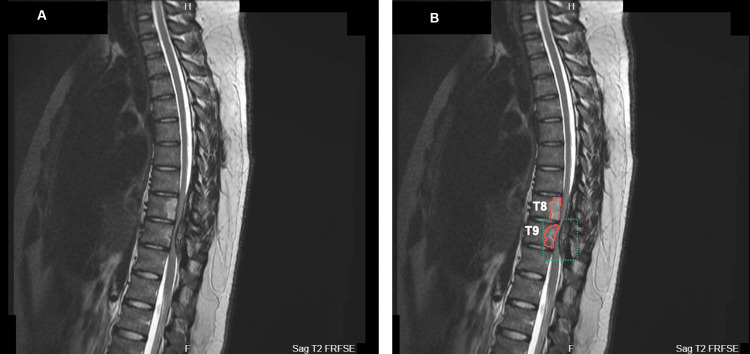
Figure 1. Sagittal T2 weighted fast recovery fast spin echo demonstrating spinal cord compression (green dotted outline) at T8 and T9 levels with relief at T10. The pathology is highlighted in (B) as compared to (A). Additional findings show an epidural lesion suggestive of myelomalacia and positive bone marrow edema (red solid outline) findings.
T8: thoracic vertebral segment 8; T9: thoracic vertebral segment 9; T10: thoracic vertebral segment 10

