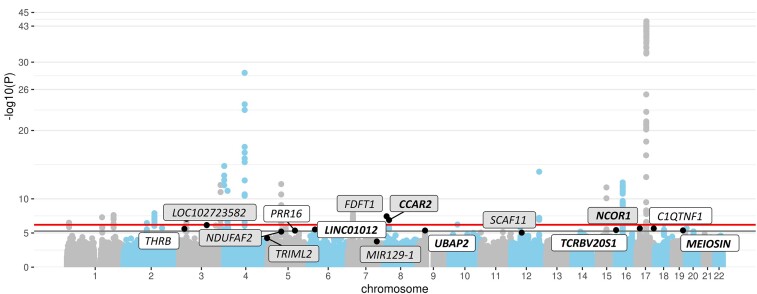
Figure 1.
Manhattan’s plot of genome-wide meta-analysis results of STRs in Parkinson’s disease risk. This Manhattan plot depicts the results of the genome-wide association analysis of 1 044 914 STRs in 19 061 Parkinson’s disease cases and 24 783 controls based on logistic regression analyses followed by fixed-effect meta-analysis of all included datasets. The y-axis displays the −log10 of the P-value (‘−log10(P)’). The upper horizontal bold line represents the study-wide significance threshold of α = 6.3 × 10⁻⁷, and the lower horizontal bold line represents the study-wide suggestive significance threshold of α = 5.3 × 10⁻⁶. STR signals that are independent from SNPs and show at least study-wide suggestive evidence for association with Parkinson’s disease status in the previous and/or in the current study are annotated with the name of the nearest gene. Gene names for previously reported study-wide suggestive or significant STR signals are displayed in grey boxes, and gene names for novel STR signals are displayed in white boxes. Gene names for which meta-analysis results increase in significance when combining our new data with the data from the IPDGC are displayed in bold.

