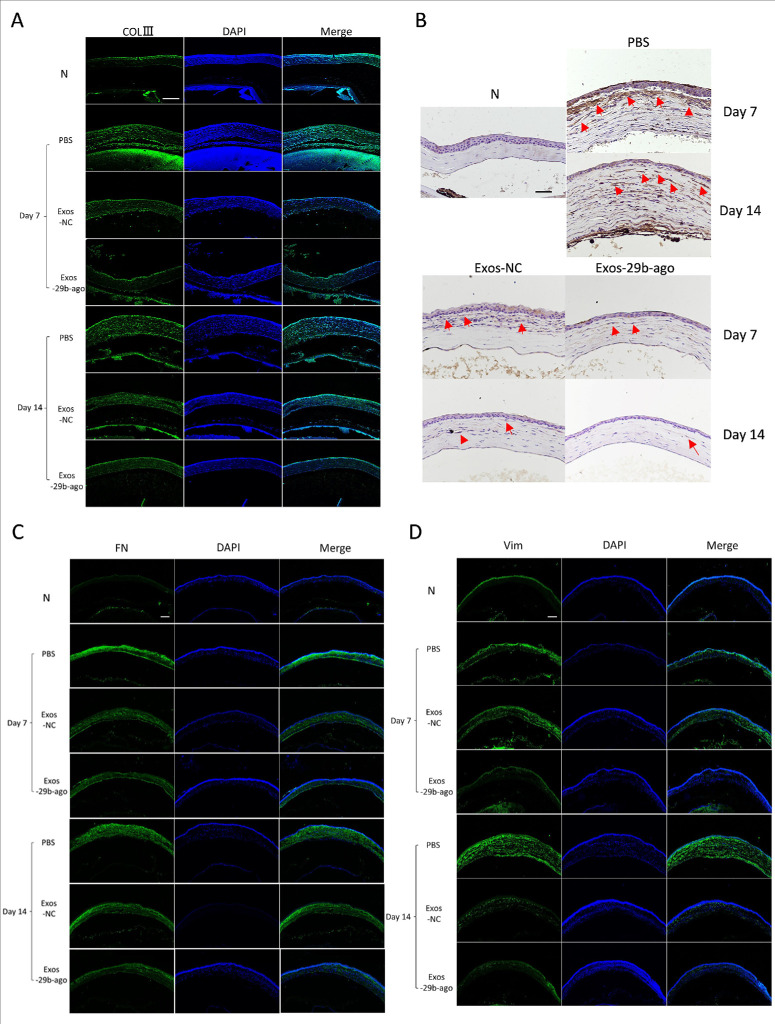
Figure 5.
Immunofluorescence and immunohistochemical results of the fibrosis-related genes in CI mice. (A) Immunofluorescence analysis of COLⅢ expression. Scale bar = 200 µm. (B) Immunohistochemical analysis of α-SMA expression. Scale bar = 100 µm. (C) Immunofluorescence analysis of FN expression. Scale bar = 200 µm. (D) Immunofluorescence analysis of Vim expression. Scale bar = 200 µm.

