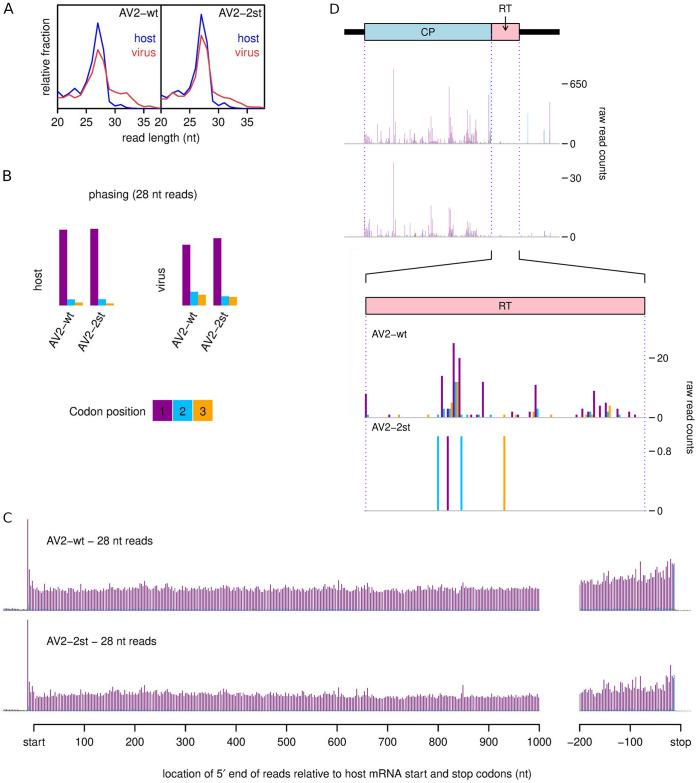
Fig 5. Ribosome profiling of systemically infected leaf tissues from N. benthamiana plants agroinfected with AV2 or AV2-2st.
(A) Relative length distributions for Ribo-Seq reads mapping to virus (red) and host (blue) mRNA coding regions. (B) Phasing of 5′ ends of 28 nt reads that map to the viral ORFs (excluding dual coding regions) or host mRNA coding regions. (C) Histograms of approximate P-site positions of 28 nt reads relative to annotated initiation and termination sites summed over all host mRNAs. For panels C and D, see SJ Fig for the 27 nt read data. (D) Distribution of 28 nt reads on the 3′ half of RNA3 for AV2 and AV2-2st. Histograms show the positions of the 5′ ends of reads, with a +12 nt offset to map approximate P-site positions. Colours purple, blue and orange indicate the three different phases relative to the reading frame of the CP ORF. Therefore, consistent with panel B, most 28 nt reads map to the purple phase in the CP ORF, and true ribosome protected fragments (RPFs) are expected to map to the purple phase in the RT ORF. Note that nucleotide-to-nucleotide variation in RPF counts may be influenced by technical biases besides ribosome codon dwell-times. Reads in the 3′UTR and a fraction of reads throughout the genome undoubtably derive from non-RPF contamination, and contamination is likely to be relatively more pronounced in the lowly expressed AV2-st (cf. SC Table). See SK Fig and SL Fig for full-genome plots and for 27 nt read data.

