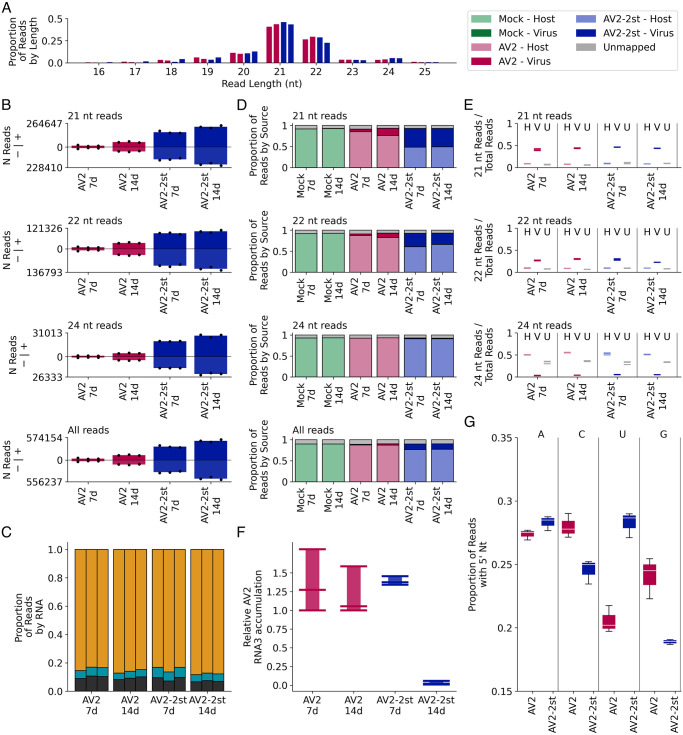
Fig 10. Characteristics of virus and host small RNAs.
(A) The number of virus mapping reads of each length, divided by the total number of virus mapping reads (summed across replicates for each time point) for the AV2 (pink, bars 1 and 2 in each block) and AV2-2st (blue, bars 3 and 4 in each block) infected samples. (B) For 21 nt, 22 nt, 24 nt and all read lengths, the normalised number of reads mapping to the positive (above axis) and negative (below axis) strands of the AV2 genome for AV2 and AV2-2st infected samples, at each time point. Bar heights show the mean for each condition and timepoint; black dots show the individual replicates. (C) The number of 21 nt reads mapping to each viral RNA, divided by the number of virus mapping reads in the replicate, separated by replicate and time point, for AV2 and AV2-2st infected samples. RNA1 is shown in black at the bottom of each bar, RNA2 in cyan in the centre, and RNA3 in orange at the top. Other read lengths are shown in SO Fig. (D) For 21 nt, 22 nt, 24 nt and all read lengths, the proportion of reads which mapped to the host (bottom section of each bar, light colours), virus (middle section, dark colours) and was unmapped for each sample (top section, grey), separated by treatment and time point, and summed across replicates (see SP(i) Fig for individual replicates). (E) The number of host mapping (left, light colours), virus mapping (middle, dark colours) and unmapped (grey) 21 nt, 22 nt and 24 nt reads, divided by the total number of reads mapping to the same destination (i.e. host, virus or unmapped), for AV2 and AV2-2st infected samples at each time point. Horizontal lines represent individual replicates. (F) RT-qPCR analysis of AV2 RNA3 accumulation in the samples used for high throughput siRNA sequencing. Nb ACT-b (GI:380505031) was used as a reference gene. Values are expressed in arbitrary units; coloured bars and black error bars represent the mean +/− SEM of three technical replicates (black dots). (G) The number of virus mapped 21 nt reads, with each possible 5′-terminal nucleotide for AV2 and AV2-2st infected samples at 14 dpi, divided by the total number of virus mapped 21 nt reads for the same sample and timepoint. See SQ Fig for 22 nt, 24 nt and all reads.

