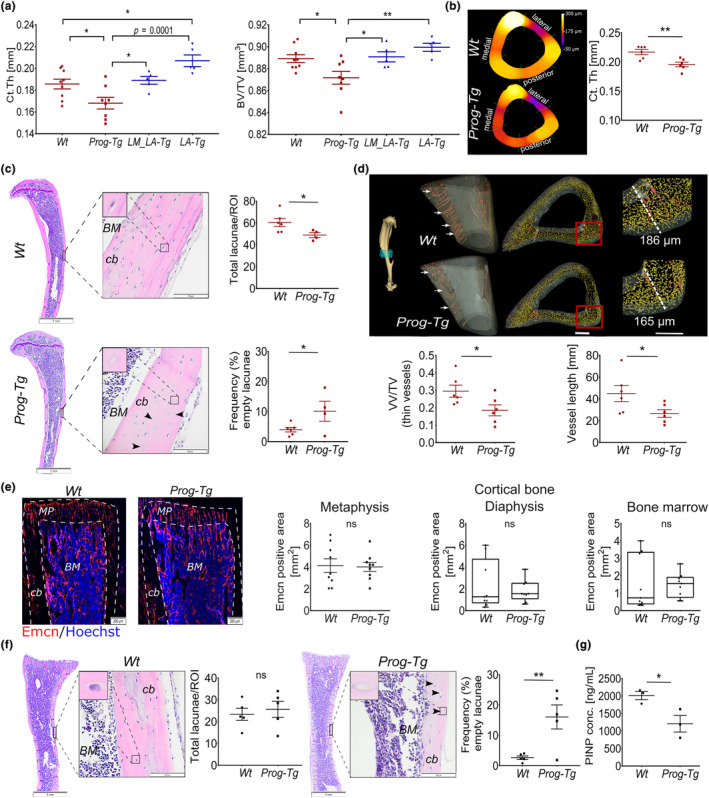
FIGURE 1.

Cortical bone thinning in Prog‐Tg mice. (a) Quantification of average cortical thickness (Ct.Th) in mm, and bone volume (BV) to total volume (TV) ratio using micro‐computed tomography of tibiae in Prog‐Tg (n ≥ 8), LA‐Tg (n = 5) and corresponding single‐transgenic littermates, Wt and LM_LA‐Tg, respectively (age = 35–40 weeks). One‐way ANOVA with post hoc Tukey's multiple comparisons test. (b) Representative cross‐sections of nanoCT images of tibiae with quantification of average Ct.Th in Wt and Prog‐Tg animals (n = 6; age = 30–35 weeks). (c) Quantification of total osteocyte lacunae as mean number per region of interest (ROI) including empty osteocyte lacunae (arrows) shown as proportion of total in [%] on HE‐stained cortical tibiae sections of Wt and Prog‐Tg (age = 30–35 weeks). Each data point represents mean values from one animal (n = 4–6). BM, bone marrow; cb, cortical bone. Scale bars, 1 mm and 100 μm. (d) Representative reconstructed 3D nanoCT images of tibiae regions marked within blue cube showing on the left panels reduced vascularization (arrows) and the right cortical thinning in Prog‐Tg compared to Wt animals (age = 30–35 weeks). Mean vascular volume fraction (VV/TV) and the mean length of blood vessels are shown below. Scale bar, 100 μm. (e) Representative images of endomucin (Emcn) stained vasculature in tibia sections from young Wt and Prog‐Tg animals (age ≤ 14 days, n = 9, with 3 biological replicates in 3 serial sections per animal). Mean endomucin positive area [%] is shown for metaphysis (MP), cortical bone (cb), and bone marrow (BM). (f) Total and empty osteocyte lacunae (see (c)) in cortical tibiae regions from young animals (age ≤ 14 days, n = 4–6). Scale bars, 1 mm and 100 μm. (g) Procollagen type I N‐terminal propeptide (PINP; ng/mL) protein levels in plasma from young animals analyzed by ELISA (age ≤ 14 days, n = 3). Unpaired two‐tailed Student's t‐test. (*p < 0.05, **p < 0.01, ns, not significant).
