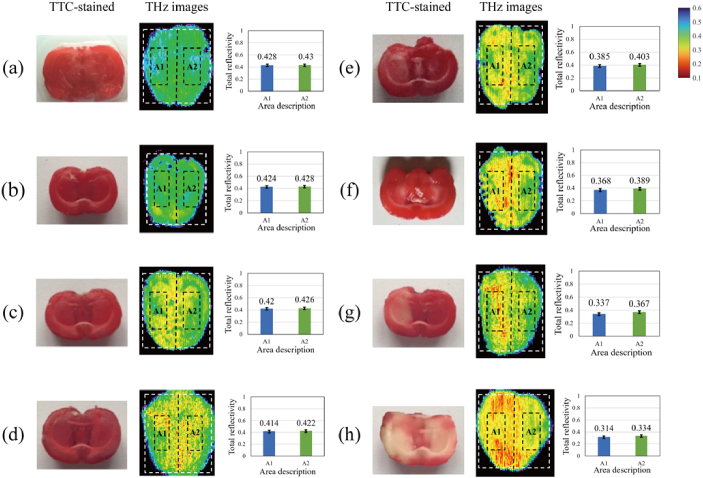
Fig. 2.
The TTC-stained images and the THz images of fresh cerebral ischemic tissue samples with different ischemic times. In THz images, some areas are marked by a dashed line, and the average total reflectivity of these areas was described in the right image. The ischemic times of cerebral samples were (a) 0 hour, (b) 1 hour, (c) 2 hours, (d) 2.5 hours, (e) 3 hours, (f) 4 hours, (g) 6 hours, (h) 24 hours, respectively.

