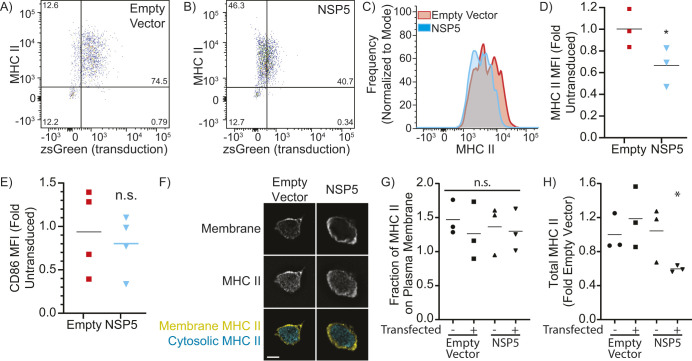
Fig. 1.
NSP5 suppresses MHC II in primary human monocyte-derived DCs. moDCs were transduced with lentiviral vectors lacking a transgene (empty vector) or bearing NSP5, with both vectors containing an IRES-zsGreen marker. (A,B) Representative flow cytometry plots showing cell surface MHC II expression and transduction (zsGreen+) of moDCs transduced with an empty vector control (A) or NSP5-expressing lentiviral vector (B). (C) Histogram of cell surface MHC II expression levels on moDCs transduced with an empty vector (red) or NSP5-expressing vector (cyan). (D,E) Quantification of cell surface MHC II (D) and CD86 (E) in moDCs transduced with either an empty (Empty) or NSP5-expressing (NSP5) lentiviral vector. The mean fluorescence intensity (MFI) is normalized to the MFI of the non-transduced cells in the empty vector condition. (F) Z-slice through a macrophage stained for MHC II and the plasma membrane, showing the segmentation of vesicular and cytosolic versus surface (membrane) MHC II. Scale bar: 10 µm. (G,H) Quantification of the fraction of MHC II on the plasma membrane (G) and total cellular MHC II (H) in macrophages that have been transfected either with an empty or NSP5-expressing vector, comparing non-transfected (zsGreen-negative) to transfected (zsGreen-positive) cells in both conditions. Data is representative of, or quantifies, a minimum of three independent experiments. Line in D, E, G and H shows the mean. *P<0.05; n.s., not significant (P>0.05) (Kruskal–Wallace test with Dunn correction compared to non-transfected empty vector).

