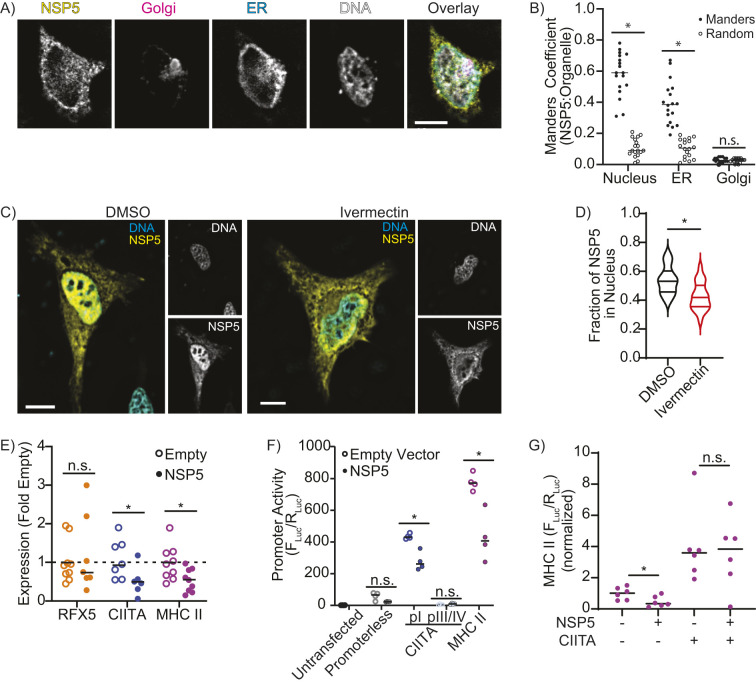
Fig. 2.
NSP5 suppresses CIITA and MHC II expression. (A,B) Fluorescence Z-projection (A) and Manders’ colocalization analysis (B) quantifying the proportion of NSP5 colocalized with the nucleus for HeLa cells co-transfected with NSP5–FLAG (yellow), TGN46–mCherry (Golgi, magenta), KDEL–eGFP (ER, cyan) and stained with Hoechst (DNA, gray). Manders colocalization analysis compares the fraction of NSP5 colocalized with the nucleus, ER and Golgi (Manders) to the Manders’ ratio from the same image when the NSP5 image was randomized (Random). (C,D) Fluorescent z-projections (C) and quantification (D, violin plot highlighting median and quartiles) of the fraction of NSP5 in the nucleus of vehicle-treated (DMSO) versus ivermectin-treated HeLa cells expressing NSP5–FLAG (yellow) and stained for DNA with Hoechst (cyan). (E) RT-qPCR quantification of RFX5, CIITA and MHC II mRNA levels in moDCs transduced with empty or NSP5-expressing lentiviral vectors. (F) Quantification of the promoter activity of the CIITA pI, CIITA pIII/IV, and MHC II promoters using a dual-luciferase assay in RAW 264.7 macrophages co-transfected with empty or NSP5-expressing lentiviral vectors. (G) Quantification of MHC II promoter activity in RAW 264.7 macrophages co-transfected with CIITA and NSP5. (−) indicates the sample was transfected with empty vector rather than CIITA or NSP5. Fluc/Rluc was normalized to the value of cells transfected with an empty vector. Images are representative of a minimum of 30 cells captured across three independent experiments. n=minimum of 3. Line in B and E–G shows the mean. *P<0.05; n.s., not significant (P>0.05) [paired two-tailed t-test (B) or Mann–Whitney test (D–G) compared to Random (B), DMSO (D), or Empty Vector (E–G)]. Scale bars: 10 µm.

