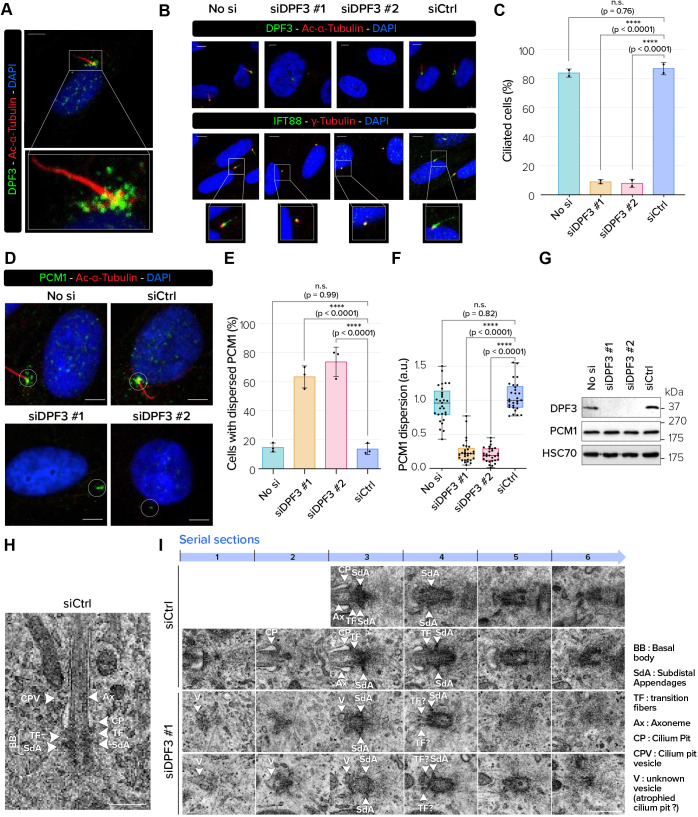
Fig. 7.
DPF3 depletion disrupts centriolar satellite stability and primary cilium formation by blocking axoneme extension. (A) Serum-starved ciliated hTERT-RPE-1 cells were co-stained for DPF3 (in green) and acetylated α-tubulin (in red). Merged channels with DAPI nuclear staining (in blue) and magnifications of boxed regions are shown. (B) hTERT-RPE-1 cells were mock-transfected (‘No si’) or transfected with one of two different DPF3 siRNAs (siDPF3 #1 and siDPF3 #2) or control siRNA (siCtrl), serum starved for 48 h, and co-stained for DPF3 or IFT88 (in green) and acetylated α-tubulin or γ-tubulin (in red). Merged channels with DAPI nuclear staining (in blue) are shown. (C) Quantification of the percentage of ciliated hTERT-RPE-1 cells after siRNA transfection as described in B. The graph shows the mean±s.d. from three independent experiments (n=50 cells/condition/experiment). (D) hTERT-RPE-1 cells were treated as in B and co-stained for PCM1 (in green) and acetylated α-tubulin (in red). Merged channels with DAPI nuclear staining (in blue) are shown. White circles indicate widely dispersed PCM1 granules in control conditions (top) and altered patterns upon siRNA treatment (bottom). (E) Quantification of hTERT-RPE-1 cells without dispersed PCM1 profiles after siRNAs transfection. The graph shows mean±s.d. from three independent experiments (n=100 cells/condition/experiment). (F) The pericentrosomal fluorescence intensity of PCM1 was measured in a circular area drawn around the centrosome, and the signal level was normalized to 1 in the ‘No si’ condition (n=10 cells/condition/experiment from three independent experiments). Boxes show the 25–75th percentiles, the line shows the median, and whiskers show the minimum and maximum values. a.u., arbitrary units. (G) Protein extracts from hTERT-RPE-1 cells transfected as described in B were analyzed by western blotting for the indicated proteins. Blots are representative of two independent experiments. (H,I) Transmission electron micrographs of mother centrioles and the axoneme (serial sections) in hTERT-RPE-1 cells transfected with control siRNA (siCtrl) or DPF3 siRNA (siDPF3 #1). White arrowheads indicate different ciliary structures described in the panel legend. Images are representative of two independent experiments. Ax, axoneme; BB, basal body; CP, cilium pit; CPV, cilium pit vesicle; SdA, subdistal appendage; TF, transition fibers; V, vesicle. Scale bars: 5 µm (A,B,D); 500 nm (H,I). P-values were calculated using one-way ANOVA with Tukey's post hoc test (C,E,F). n.s., not significant; ****P<0.0001.

