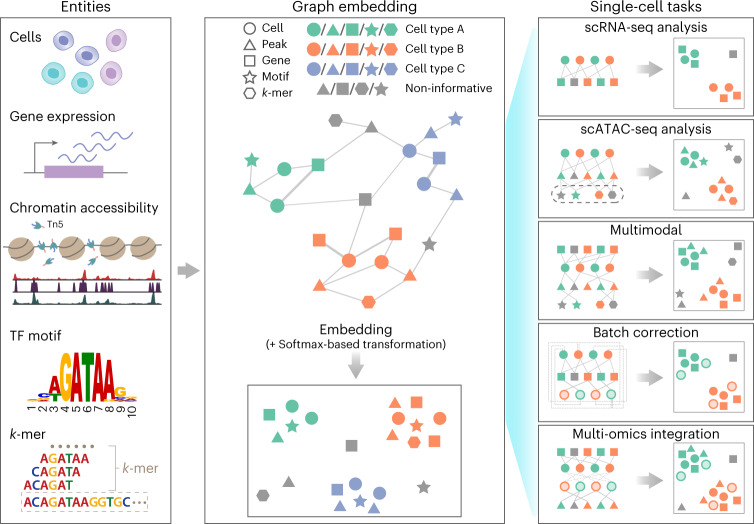
Fig. 1. SIMBA framework overview.
SIMBA co-embeds cells and various features measured during single-cell experiments into a shared latent space to accomplish both common tasks involved in single-cell data analysis and tasks that remain as open problems in single-cell genomics. Left, examples of possible biological entities that may be encoded by SIMBA, including cells, gene expression measurements, chromatin-accessible regions, TF motifs and k-mer sequences found in reads. Middle, SIMBA embedding plot with multiple types of entities into a low-dimensional space. All entities represented as shapes (cell, circle; peak, triangle; gene, square; TF motif, star; k-mer, hexagon) are colored by relevant cell type (green, orange and blue in this example). Non-informative features are colored dark gray. Within the graph, each entity is a node, and an edge indicates a relation between entities (for example, a gene is expressed in a cell, a chromatin region is accessible in a cell, or a TF motif or k-mer is present within an open chromatin region.). Once connected in a graph, these entities may be embedded into a shared low-dimensional space, with cell-type-specific entities embedded in the same neighborhood and non-informative features embedded elsewhere. Right, common single-cell analysis tasks that may be accomplished using SIMBA. Different opacity levels indicate cells of different experimental batches or single-cell modalities. Solid lines indicate experimentally measured edges. Dashed lines indicate computationally inferred edges.

