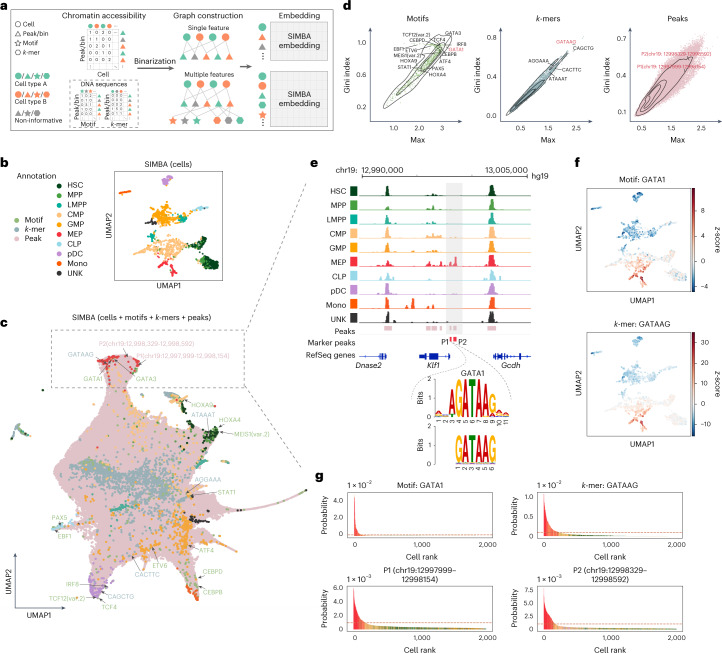
Fig. 3. Single-cell ATAC-seq analysis of the human hematopoiesis dataset using SIMBA.
a, SIMBA graph construction and embedding in scATAC-seq analysis. Biological entities including cells, peaks or bins, TF motifs and k-mers are represented as shapes and colored by relevant cell types (green and orange). Non-informative features are colored dark gray. Cells and chromatin-accessible features (peaks/bins) are organized into a cell × peak/bin matrix. When sequence information (TF motif or k-mer sequence) within these regions is available, they can be organized into two sub-matrices to associate a TF motif or k-mer sequence with each peak or bin. These constructed feature matrices are then binarized and assembled into a graph. When a single feature (chromatin accessibility) is used, the graph encodes cells and peaks/bins as nodes. When multiple features (both chromatin accessibility and DNA sequences) are used, this graph may then be extended with the addition of TF motifs and k-mer sequences as nodes. Finally, SIMBA embeddings of these entities are generated through a graph embedding procedure. b, UMAP visualization of SIMBA embeddings of cells colored by cell type. c, UMAP visualization of SIMBA embeddings of cells and features including TF motifs, k-mers and peaks. Cells are colored by cell type, while motifs, k-mers and peaks are colored green, blue and pink, respectively. Cell-type-specific features that are embedded near their corresponding cell types are indicated as the text labels (colored according to feature type) with arrows. d, SIMBA metric plots of TF motifs, k-mers and peaks. Cell-type-specific features annotated in c are highlighted. e, Genomic tracks of aligned scATAC-seq fragments, separated and colored by cell type. Two marker peaks P1 and P2 in red are shown beneath the alignment. Within the peak P1, k-mer GATAAG and its resembling GATA1 motif logo are highlighted. f, UMAP visualization of SIMBA embeddings of cells colored by TF activity scores of the GATA1 motif and k-mer GATAAG enrichment. g, SIMBA barcode plots of the GATA1 motif, the k-mer GATAAG and the two peaks P1 and P2. Cells are colored according to cell type labels described above. The dashed red line indicates the same cutoff used in all four plots.

