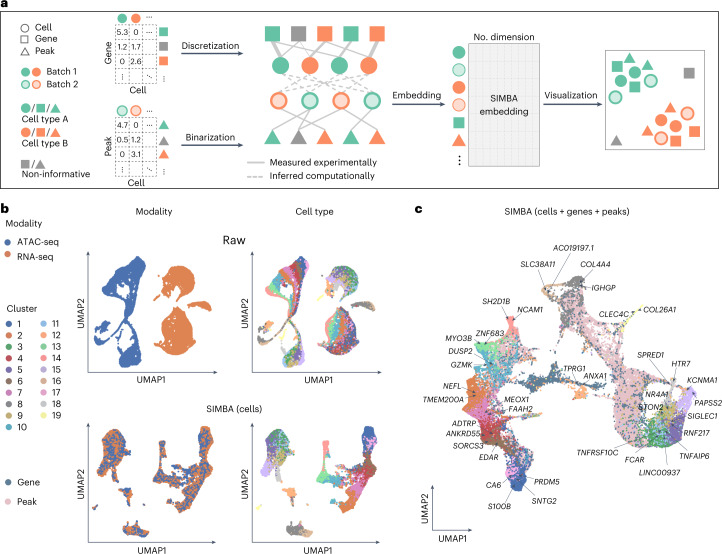
Fig. 6. Multi-omics integration of scRNA-seq and scATAC-seq data using SIMBA.
a, SIMBA graph construction and embedding in multi-omics integration. Overview of SIMBA’s approach to data integration across scRNA-seq and scATAC-seq. Distinct shapes indicate the type of entity (cell, gene or peak). Colors distinguish batches or cell types. b, UMAP visualization of the integrated scRNA-seq and scATAC-seq data manually created from the 10x human PBMCs dataset before and after data integration. Cells are colored by single-cell modality and cell type, respectively. Top, UMAP visualization before integration. Bottom, UMAP visualization after integration with SIMBA. c, UMAP visualization of SIMBA embeddings of cells, genes and peaks, with two cell modalities integrated and known marker genes highlighted.

