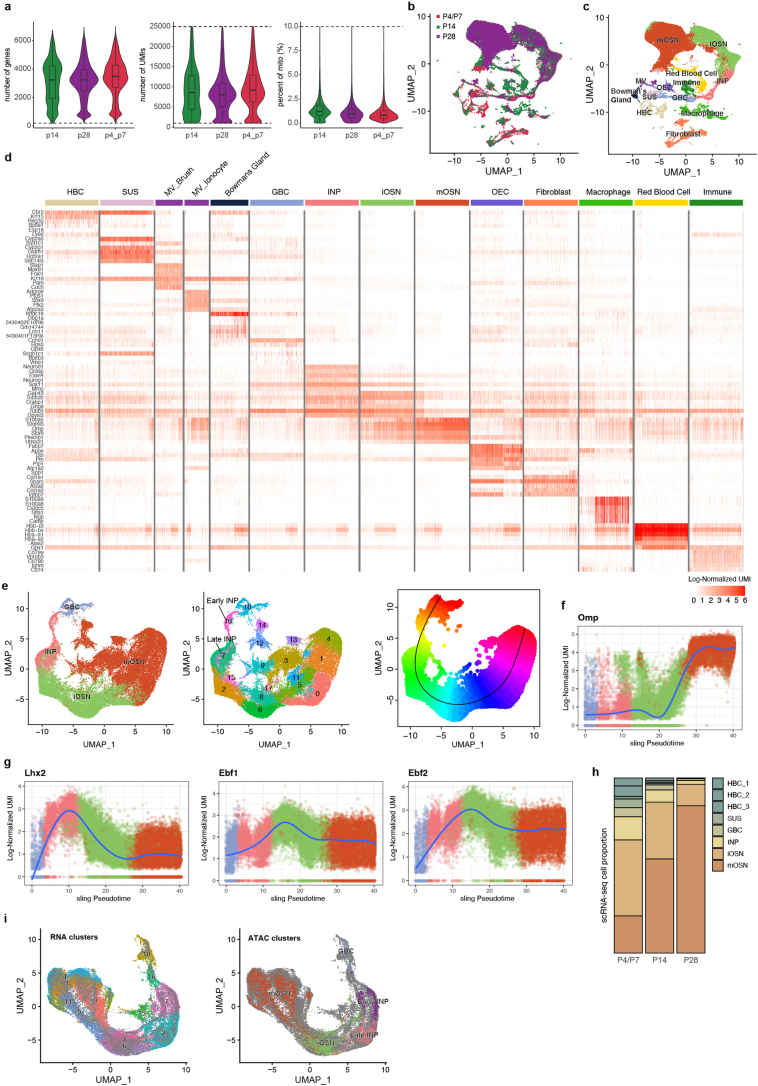
Extended Data Fig. 8. Quality control and overview of MOE scRNA-seq results.
a, Number of detected genes, UMI counts, and percentage of mitochondrial UMIs for cells from P4/P7 (N = 28,303), P14 (N = 24,116), and P28 (N = 21,158) mice. b-c, UMAP of scRNA-seq data colored by origin batch (b) and cell types (c). The box horizontal line and the box represent the median and quartiles, respectively, and the whiles extends 1.5*interquartile range. d, Heatmap shows the expression of marker genes of each cell type. For cell types with more than 1,000 cells, top 1,000 representative cells with the highest UMI counts are shown. e, UMAP of the subset of scRNA-seq dataset including GBCs, INPs, iOSNs, and mOSNs, colored by previously identified cell types (left), new clusters (middle), and pseudotime (right). f-g, Dynamics of the expression of Omp (f), and Lhx2, Ebf1, Ebf2 (g) during the development of MOE. h, Proportion of cell types associated with MOE development for cells from P4/P7, P14, and P28 mice in the scRNA-seq dataset. i, UMAP of the co-embedded METATAC and scRNA-seq data from GBC to mOSN, colored by RNA clusters (left) and METATAC clusters (right).

