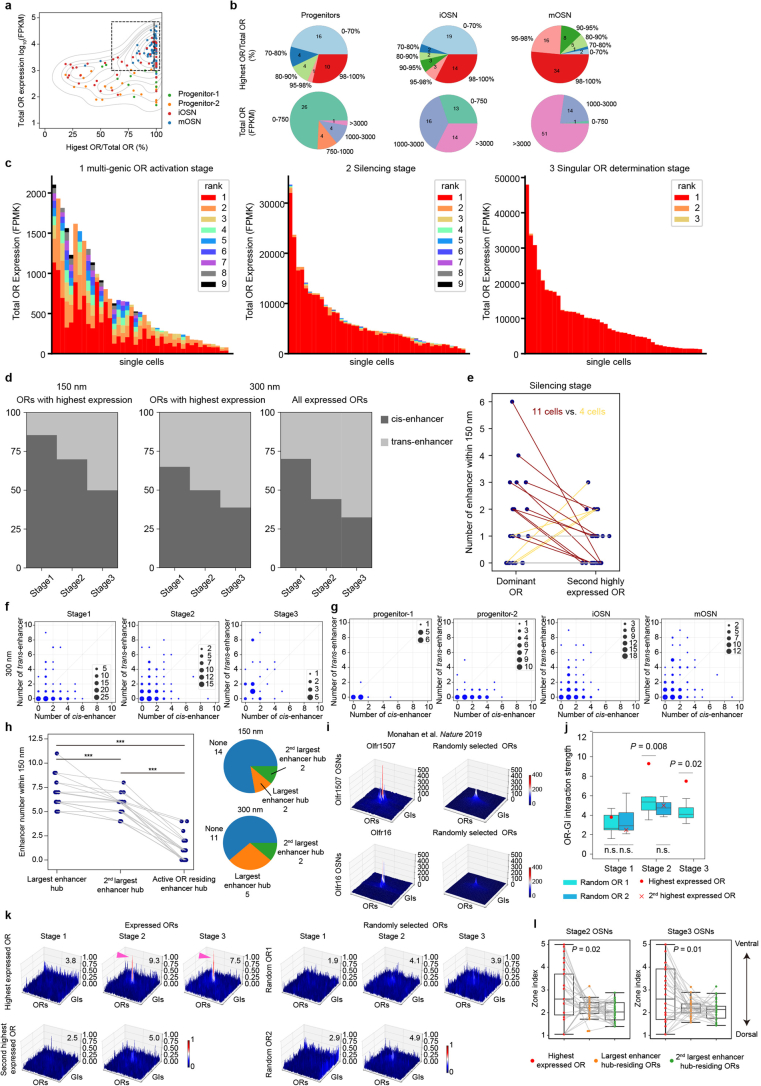
Extended Data Fig. 10. The spatial relationship between expressed OR genes and their enhancers.
a, The same as Fig. 3a, cells are colored according to cell identity. b, Pie chats summarize the OR gene expression information. c, OR FPKM values within single cells of each stage. Each color represents an individual OR, except black, which represents all OR ranked below 8. d, Composition of cis or trans GIs within 150 nm or 300 nm from expressed ORs (considering all expressed ORs). e, Same as Fig. 3f but for the number of GIs within 2.5 particle radii (150 nm) from each expressed OR in single cells. f, Summary of the number of nearby cis- and trans-GIs for each OR in different stages. g, Same as f but grouped by different cell types. h, Left: Same as Fig. 3g but for within 2.5 particle radii (150 nm). Two-sided Wilcoxon signed-rank test for paired sample was used, *** indicates P < 0.01. Right: pie chart depicting the number of cells with active OR residing the largest GI aggregate, the second largest GI aggregate, and others. i, 3D surface plot showing the normalized interaction strength between active OR or inactive ORs (100 randomly selected OR genes) and inter-chromosomal OR enhancers for bulk Hi-C data on OSNs expressing Olfr1507 (left) and Olfr16 (right). Data from ref. 17. j, Boxplot showing the quantification of OR-enhancer interactions for the highest expressed ORs and second highest expressed ORs (stage1 and stage 2 OSNs) and randomly selected inactive ORs, for the random OR control, 10 independent sampling was performed. P values are from two-sided one-sample t-tests. k, 3D surface plot showing the normalized interaction strength between active ORs and inter-chromosomal OR enhancers (left) or between randomly selected inactive ORs and inter-chromosomal OR enhancers (right) of LiMCA data. l, Boxplot showing the zone index of the highest expressed ORs and ORs residing within the largest or second largest enhancer hub, only stage 2 and stage 3 OSNs harboring a dominant OR were analyzed, the same cell was connected with a line. P values are from two-sided Wilcoxon signed-rank tests.

