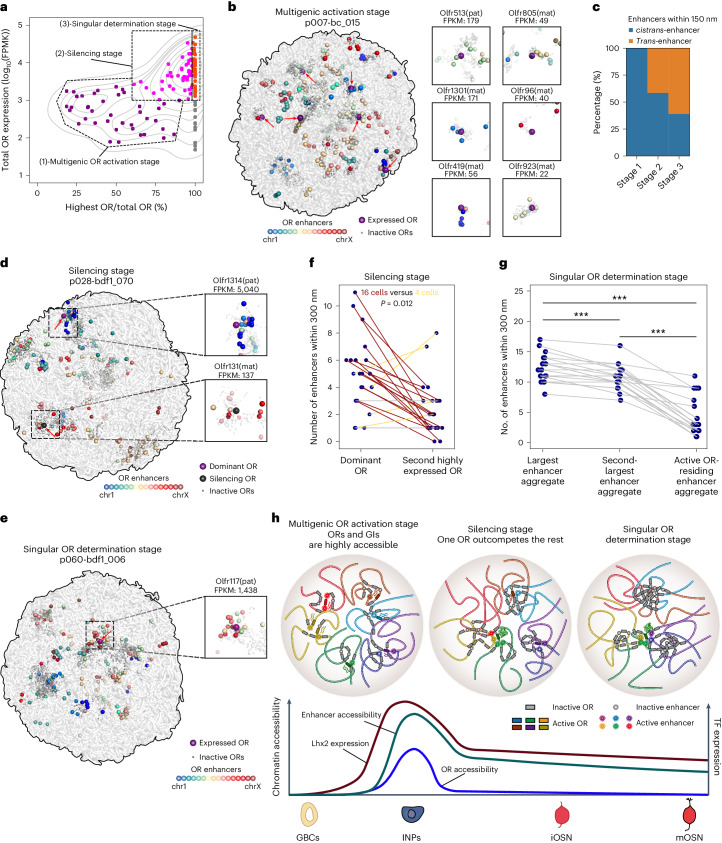
Fig. 3. Stepwise OR determination observed with single-cell joint profiling of chromatin architecture and gene expression.
a, Cells were classified into three stages based on the total OR expression level and the ratio of OR with highest expression level of the developing OSNs (progenitor, iOSN and mOSN). b, The 3D positioning of ORs and enhancers in a representative cell at multigenic OR activation stage with expressed ORs depicted in detail, revealing that cis-enhancer activates their expression. c, Histogram summarizing the percentage of cis-enhancers and trans-enhancers within 150 nm of expressed ORs for three OR expression stages. d, The 3D positioning of ORs and enhancers in a representative cell at silencing stage with the dominant and silencing OR depicted in detail. e, The 3D positioning of ORs and enhancers in a representative cell at singular OR activation stage with the selected OR depicted in detail. f, Number of enhancers within 300 nm of active dominant OR and second-highest expressed OR of the same cell (connected with a line). Statistical significance is labeled. A two-sided Wilcoxon signed-rank test was used. g, Number of OR enhancers of the largest enhancer aggregate, second-largest enhancer aggregate and active OR-residing enhancer aggregate of the same cell within 5 particle radii (300 nm) (connected with a line, n = 18). A two-sided Wilcoxon signed-rank test for paired data was used, ***P < 0.01. h, Illustration showing the stepwise OR gene determinations and their coordination with OR enhancers, the accessibility of OR enhancers and OR genes, and the expression of Lhx2 along OSN development is shown below.

