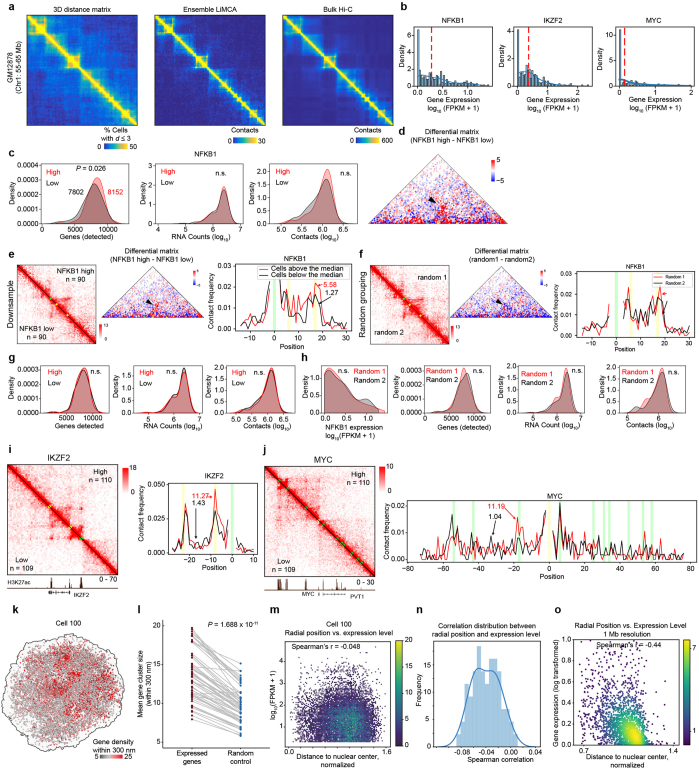
Extended Data Fig. 3. The relationship between 3D genome organization and expression.
a, Comparison of pairwise 3D distance matrix measured, ensemble LiMCA and bulk Hi-C contact map. b, Histogram of expression level distribution for NFKB1 (left), IKZF2 (middle) and MYC (right). c, Histogram showing the distribution of detected gene numbers (left), RNA counts (middle) and contact numbers between NFKB-high and NFKB1-low group. n.s., no significance, two-sided Mann-Whitney U rank test. d, Differential contact matrix around NFKB1 (chr4: 102.3–102.8 Mb) between NFKB1-high and low groups. e, Downsample analysis for NFKB1 gene. Left: contact matrices around NFKB1 (chr4: 102.3–102.8 Mb), representing ensemble Hi-C data from NFKB-high (top left) and NFKB1-low (bottom right). Middle: Differential matrix between NFKB-high and NFKB1-low group. Right: Normalized contact frequency plot, centered at NFKB1 upstream enhancer. f, The same as e, but cells are randomly grouped. g-h, The same as c, showing downsampled groups (g) and randomly assigned groups (h). n.s., no significance, two-sided Mann-Whitney U rank test. i, Left: Ensemble contact maps comparing IKZF2-high and (bottom left) and IKZF2-low (top right). Right: 4 C visualization of interactions between enhancer and the expressed gene, viewpoint centered at downstream enhancer. The green dot/line shows the position of candidate enhancer and the yellow dots/lines represent the position of TSS and TTS. j, The same as i but for MYC. k, Expressed genes spatial distribution of a representative GM12878 cell, genes are colored by gene number within 300 nm. l, Dotplot showing the median gene cluster size within 300 nm for expressed genes and randomly selected genes, the same cell was connected with line (n = 68). Two-sided Wilcoxon signed-rank test for paired data. m, Scatter-plot of expression level versus the normalized radial position at 20 kb resolution of a representative GM12878 cells. n, Correlation distribution of normalized radial position versus expression level among single cells. o, The same as i, but for mean expression level versus median radial position across cell population at 1 Mb resolution.

