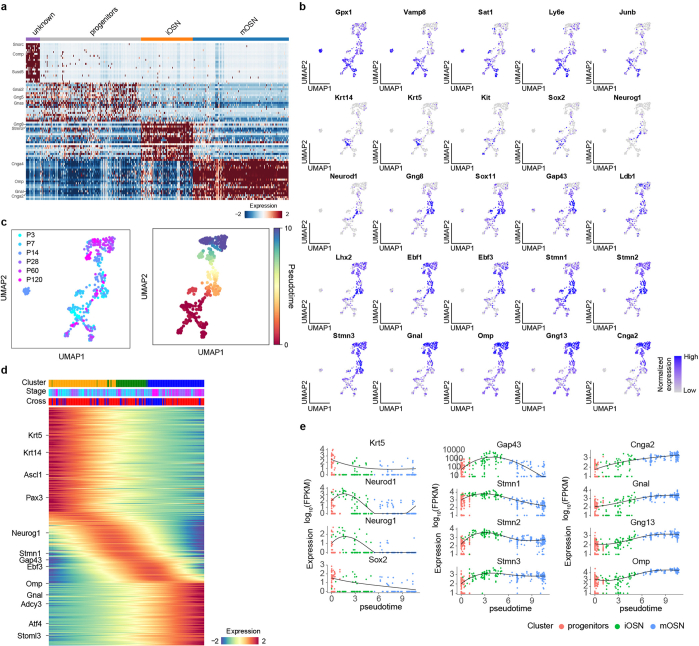
Extended Data Fig. 4. Gene expression of the single-cell LiMCA multi-omics atlas recapitulate the continuous OSN genesis and marker gene expression.
a, Expression of top cell-type-specific marker genes. The top 20 maker genes are plotted. b, UMAP projection of known maker genes for OSN progenitors, iOSNs and mOSNs. c, The same as Fig. 2c (left), colored by mouse age and pseudotime. d, Heatmap showing the continuous gene expression change along OSNs genesis using pseudotime. e, Scatter-plot showing the dynamic gene expression of known maker genes.

