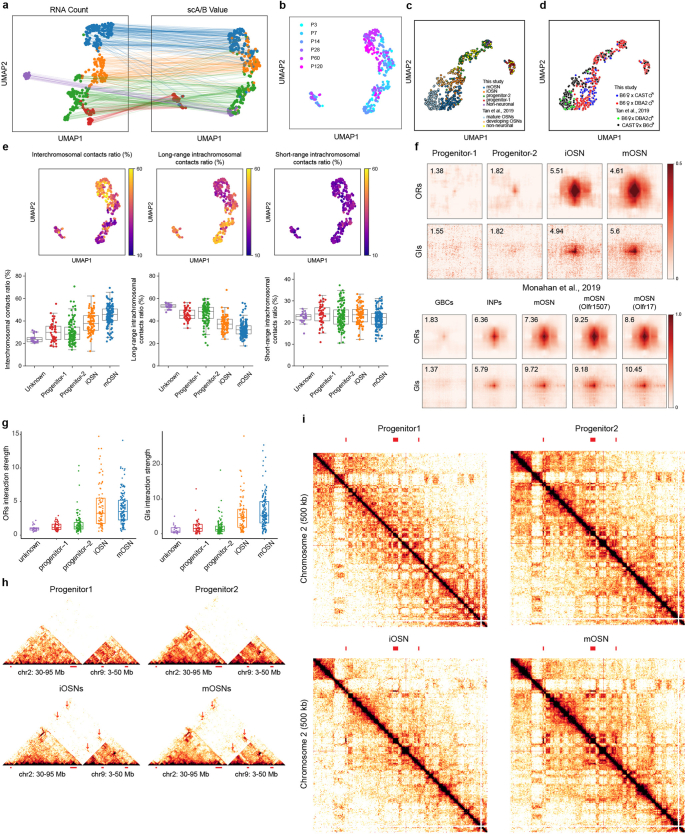
Extended Data Fig. 5. LiMCA recaptures the characteristic 3D genome reorganization along OSNs development.
a, The same as Fig. 2c, The same cell was connected in the two embeddings. b, The same as Fig. 2d (right), cells were colored by mouse age. c, UMAP showing the embedding of integrated MOE cells of this study and published MOE data (Tan et al.18, Nat. Struct. Mol. Biol. 2019), cells are colored by cell label in each dataset. d, The same as c, cells are labeled by different mouse crosses. e, UMAP visualization of inter-chromosomal contact ratio, long-range (> 20 kb) intra-chromosomal ratio and short-range (< 20 kb) intra-chromosomal ratio (top), and the boxplot quantification of these values, the black horizontal line and the box represent the median and quartiles, respectively (bottom). The whiskers indicates minima and maxima. (non-neuronal, n = 22; progenitor1, n = 47; progenitor2, n = 111; iOSN, n = 85; mOSN, n = 146). f, Pile-up of interactions between ORs and GIs of ensemble interaction profiles from each cluster (top), and bulk Hi-C datasets from Monahan et al.17, (2019) (bottom). g, Boxplot showing the gradual increasing of OR-OR, GI-GI interaction strength along OSN development. The box horizontal line and the box represent the median and quartiles, respectively. (non-neuronal, n = 22; progenitor1, n = 47; progenitor2, n = 111; iOSN, n = 85; mOSN, n = 146). h, Contact maps of ensemble interaction profiles of each cell cluster at regions of chr2: 30–95 Mb and chr9: 3–50 Mb, OR gene clusters are indicated. i, Contact maps of ensemble interaction profiles of each cell cluster of chromosome 2 (left).

