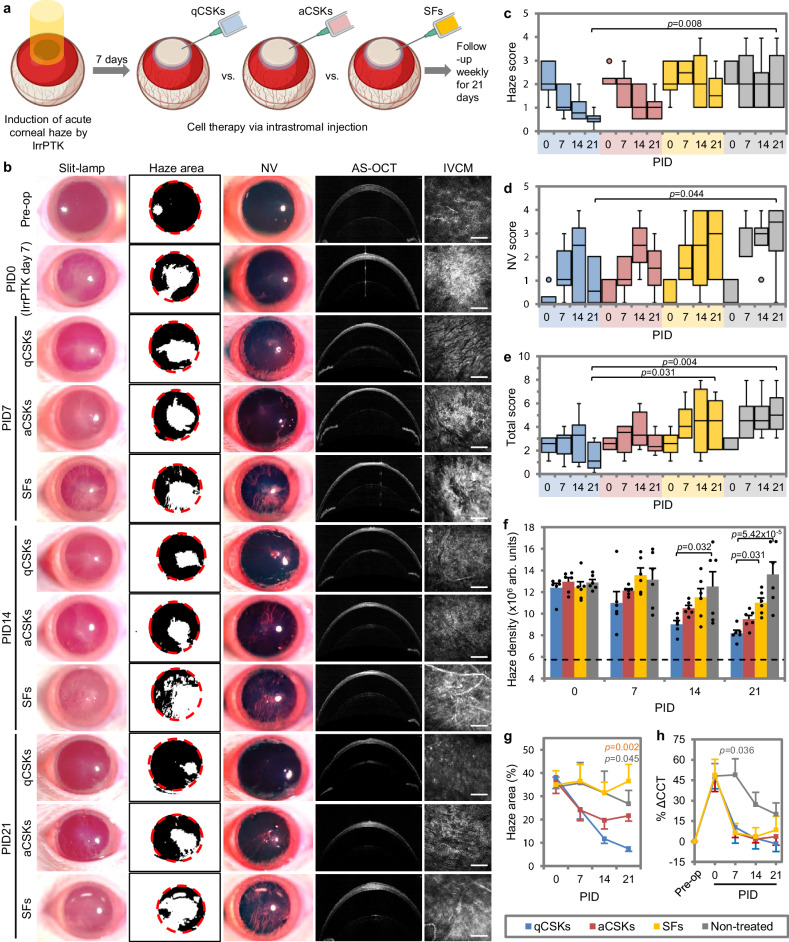
Fig. 2. Postoperative outcomes of cell injections in corneas with excimer laser-induced acute opacity.
a Experimental setup and timeline. The treatment outcomes were also compared to the non-treated corneas (see Supplementary Fig. 4 for the imaging results). b The corneal imaging showed that quiescent corneal stromal keratocytes (qCSKs) had the best therapeutic efficiency, followed by activated CSKs (aCSKs) and then stromal fibroblasts (SFs). SF injection also produced haze reduction albeit in a less efficient manner compared to the qCSKs, which was most likely caused by the increasing neovascularization (NV). The non-treated corneas exhibited persistently severe corneal haze and NV at any time point. The slit-lamp observation was supported by the haze (c), NV (d), and total grades (e). In the box plots, the center line shows the median score; box limits show the 1st and 3rd quartile; whiskers show minimum and maximum values; and points indicate outliers. Statistical significance was assessed with Kruskal–Wallis, followed by post hoc Dune-Bonferroni test. f The opacity was substantiated by the IVCM-based haze density measurements. The dash line indicates the mean of haze density preoperatively. g From a haze area point-of-view, the SFs and non-treated groups demonstrated almost no changes from PID0. The qCSKs showed the highest efficiency in haze area reduction, followed by aCSKs. The significant p values were relative to the qCSKs. h The % ΔCCT over time did not differ in the qCSKs, aCSKs, and SFs groups. On the other hand, the CCT reduction was also observed in the non-treated corneas, albeit at a lower rate. The significant p value was relative to the qCSKs. Data are presented as mean ± SEM. Statistical significance was analyzed with one-way ANOVA, followed by post hoc Tukey test. The qCSKs, aCSKs, SFs, and non-treated are represented by blue, red, yellow, and gray in the box plots, bar graphs, and line graphs. n = 6 rats in each group. Scale bars = 100 µm. Source data are provided as a Source Data file.

