Fig. 3.
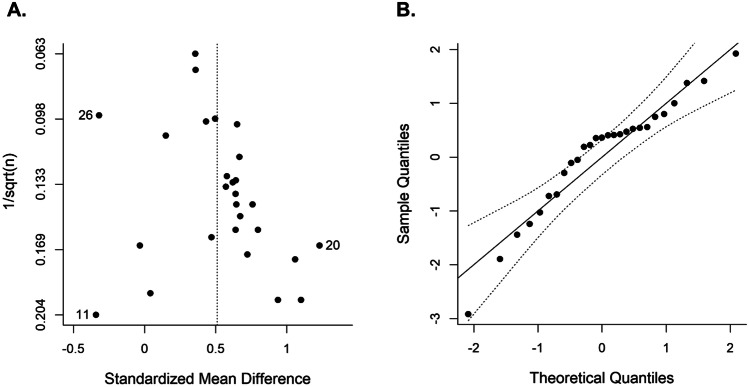
Plots for assessment of publication bias. A Funnel plot for SSRT plotting SMDs against the inverse of the square root of the sample size. B Normal quantile–quantile plot, plotting the quantiles of a standard normal distribution against the quantiles of the observed distribution. The points should fall on a straight line and inside the 95%-confidence bands. 11Cubillo et al. (2010), 20Murphy et al. (2002), 26Szekely et al. (2017)

