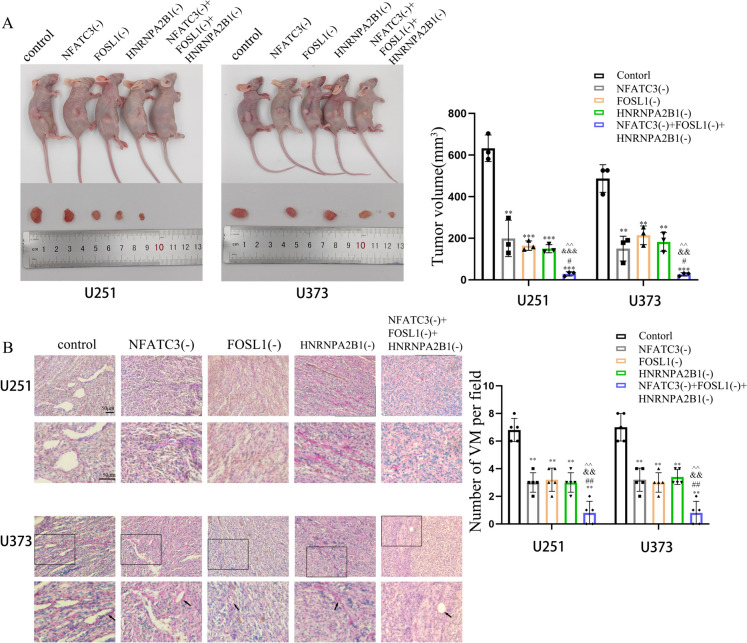
Fig. 7.
Knockdown of NFATC3, FOSL1 and HNRNPA2B1 impaired the growth of tumor xenografts and VM formation in nude mice. A Nude mice alongside their corresponding, excised tumor xenografts are shown. The chart represents the volumetric measurements of tumors removed for each condition. Compared with the control group, **p < 0.01 and ***p < 0.001; compared with the NFATC3(-) group, #p < 0.05; compared with the FOSL1(-) group, &&p < 0.01 and &&&p < 0.001; compared with the HNRNPA2B1(-) group, ^^p < 0.01. B VM in transplanted tumor sections were stained for CD31-PAS stained. Images taken at 200 × magnification. For the series of images on the upper row, a corresponding image magnified at 2X is presented correspondingly below. The black arrows point to VM structures. Compared with the control group, **p < 0.01; compared with the NFATC3(-) group, ##p < 0.01; compared with the FOSL1(-) group, &&p < 0.01; compared with the HNRNPA2B1(-) group, ^^p < 0.01

