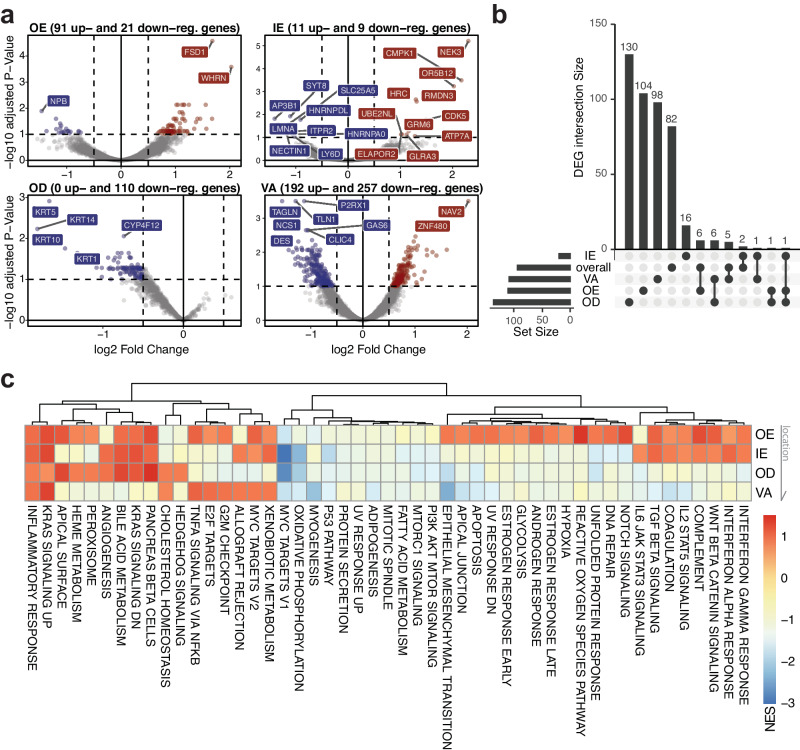
Fig. 2. Region-specific gene expression profile and cellular composition changes.
a Volcano plot showing DEGs by ROI types—OE, IE, OD, and VA respectively; the number of DEGs were determined by cutoffs of adjusted p value < 0.1 and |log2FC| > 0.5 (using DESeq2 method), b UpSet plots comparing the intersections of region-specific DEGs, c Hallmark, non-germline gene set enrichment analysis across four ROI types; NES Normalized Enrichment Scores; Arrow indicates tissue locations, where OE is the outermost layer and VA is the innermost layer. Source data are provided as a Source Data file.

