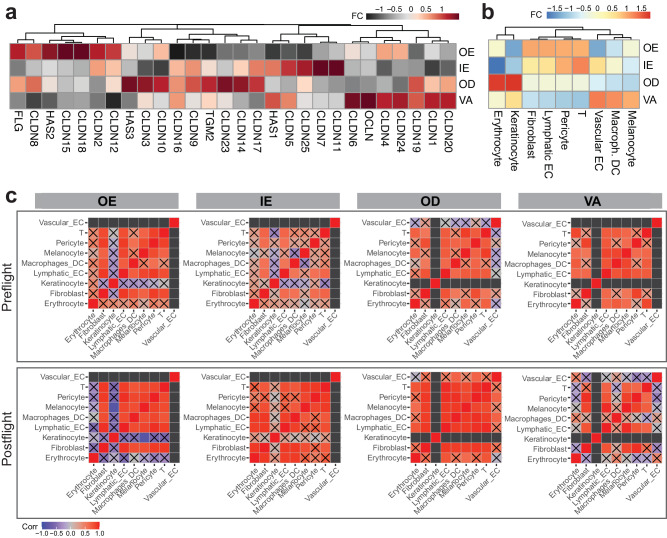
Fig. 3. Cellular microenvironment changes from spaceflight by tissue region.
a Gene expression changes of interest, b fold change of proportions in post-flight samples relative to pre-flight samples, by compartments, c cell type correlation matrix changes. Black boxes represent undetermined spots (due to minimal cell counts); boxes with X marks represent correlations that did not pass statistical testing (p value < 0.05, Pearson correlation, two-sided). Source data are provided as a Source Data file.

