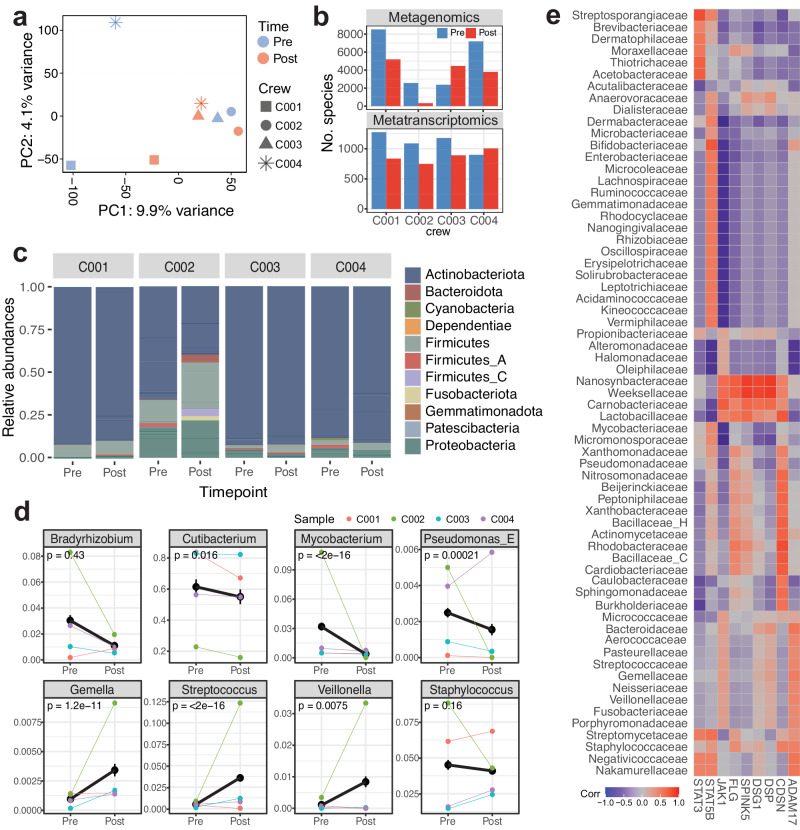
Fig. 4. Skin metagenomics and transcriptomics analysis for skin-microbiota interaction map.
a PCA across all metagenomic and metatranscriptomic (bacterial and viral reads) relative abundance features and all crew members pre- and post-flight, b Total number of bacterial and viral species with nonzero counts, c Relative abundances by sample and timepoint, grouped by family, d Changes in relative abundance before and after spaceflight, grouped by genus; statistically significant or previously reported microbes are visualized (two-sided Wilcoxon test across four crew members was performed to compare means between pre- and post-flight samples and to obtain p values, and error bars represent the standard error of the mean), and e Correlation across relative abundance of bacterial phyla identified by metagenomics data and known barrier/immune genes associated with skin diseases and disruptions. Source data are provided as a Source Data file.

